Fig. 3
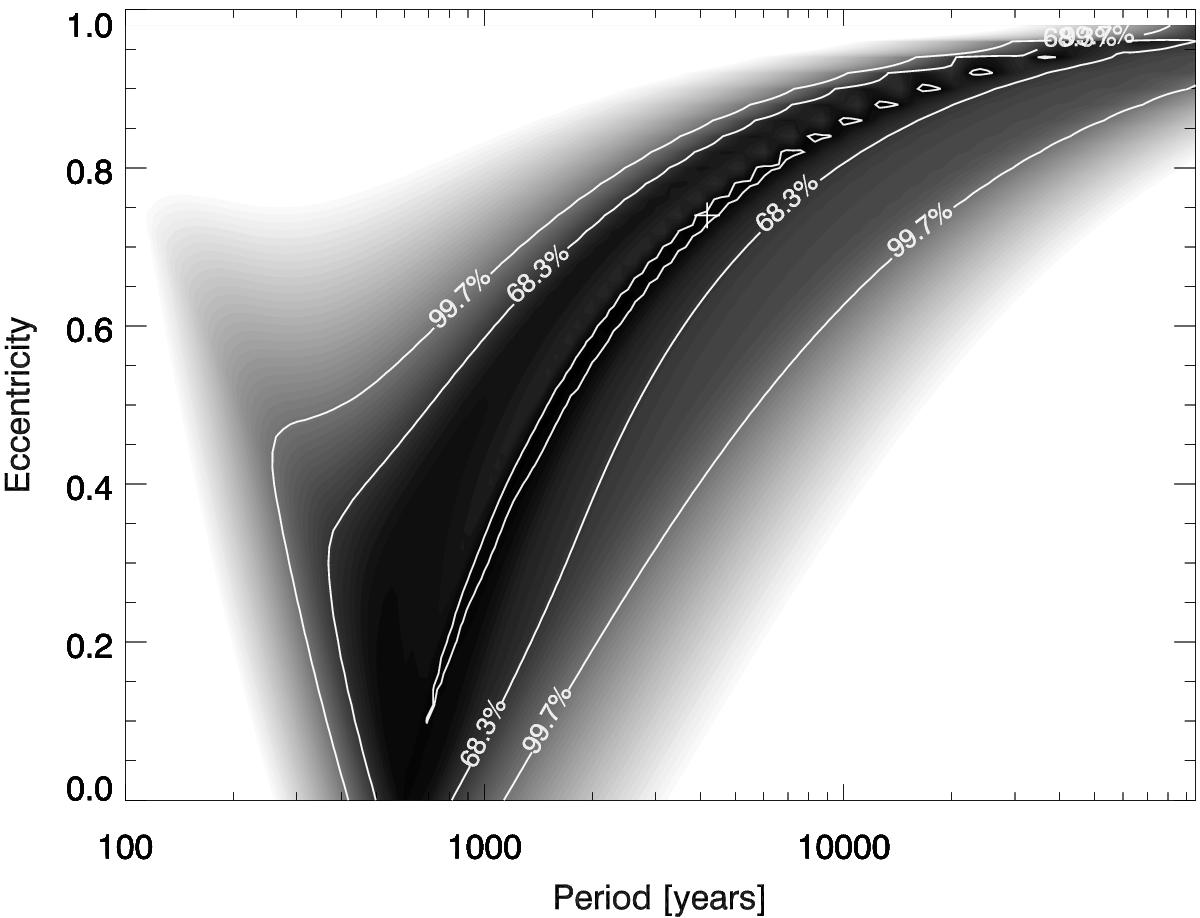
χ2 as function of period and eccentricity for the orbit of T Tau S around T Tau N. The cross marks the location of the best-fitting orbit solution (see Table 4). Contour lines show the 68.3% and 99.7% confidence regions (equivalent to 1σ and 3σ for a normal distribution). The innermost contour line is at ![]() . This has no particular significance, but demonstrates how flat χ2 is around the minimum.
. This has no particular significance, but demonstrates how flat χ2 is around the minimum.
Current usage metrics show cumulative count of Article Views (full-text article views including HTML views, PDF and ePub downloads, according to the available data) and Abstracts Views on Vision4Press platform.
Data correspond to usage on the plateform after 2015. The current usage metrics is available 48-96 hours after online publication and is updated daily on week days.
Initial download of the metrics may take a while.