Free Access
Fig. 5
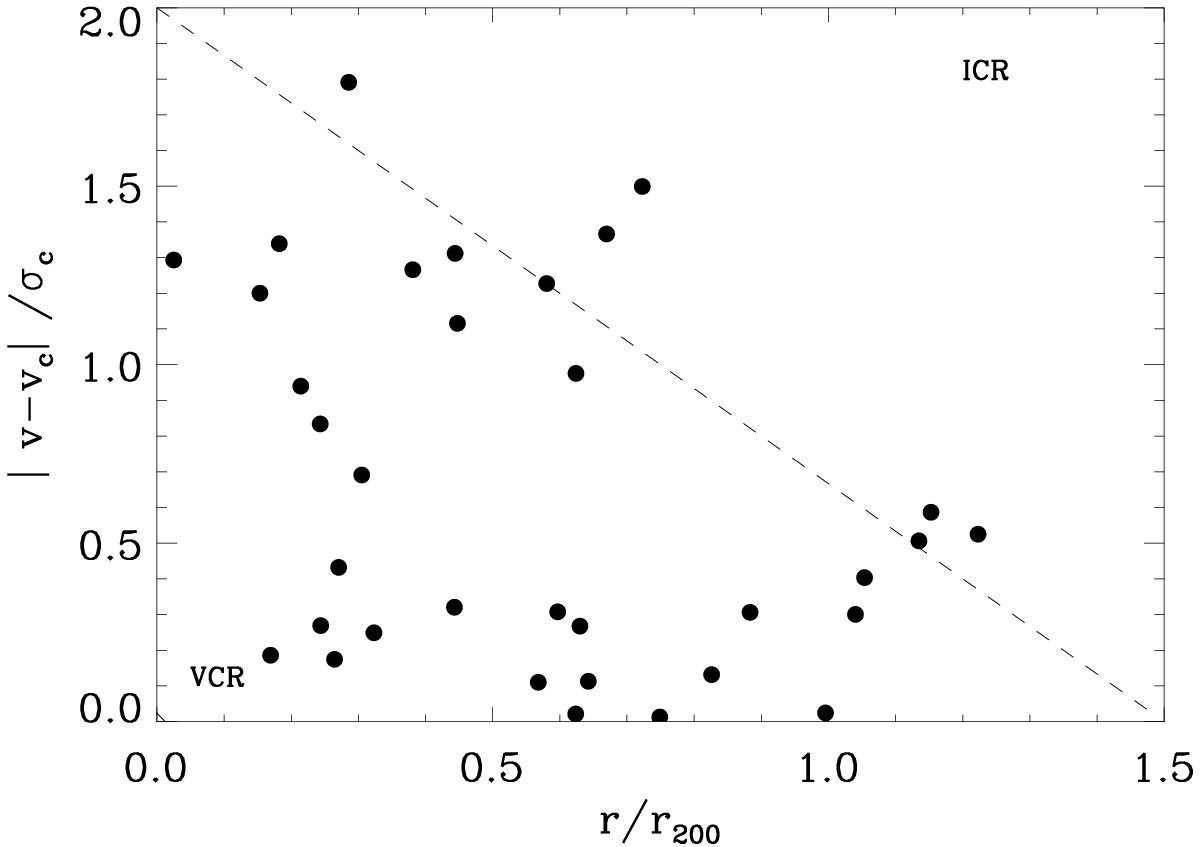
Distribution of dS0 galaxies (black points) in the phase-space diagram. The diagonal dashed line divides the phase-space diagram between the infall cluster region (ICR) and the virialized cluster region (VCR) (see Oman et al. 2013).
Current usage metrics show cumulative count of Article Views (full-text article views including HTML views, PDF and ePub downloads, according to the available data) and Abstracts Views on Vision4Press platform.
Data correspond to usage on the plateform after 2015. The current usage metrics is available 48-96 hours after online publication and is updated daily on week days.
Initial download of the metrics may take a while.