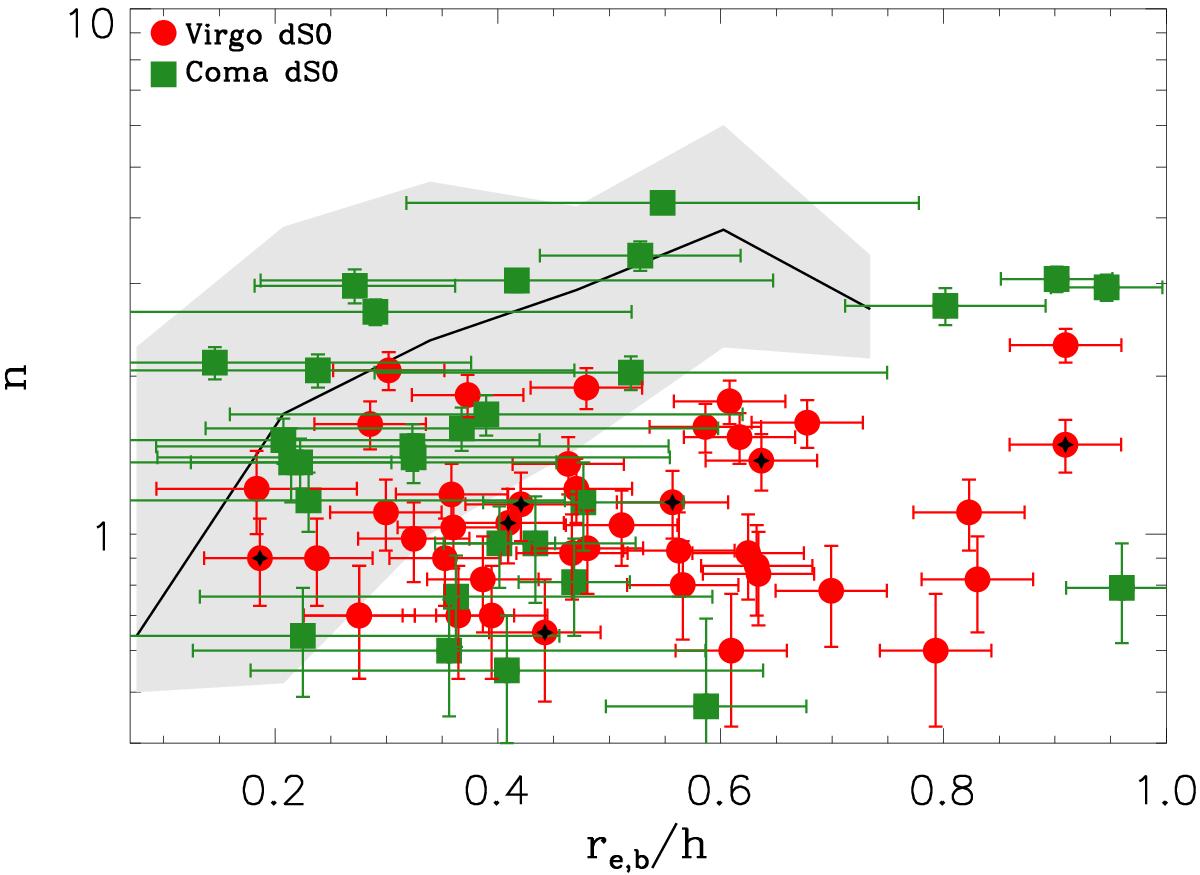
Fig. 2

Distribution of bright disc galaxies (grey region) and dS0 (red dots and green squares) in the rb,e/h–n plane. The grey region represents the locus of 95% of the bright disc galaxies in this plane. The solid line shows the median of the distribution of the bright disc galaxies. The upper right corner of the rb,e/h–n relation for bright disc galaxies is mainly made by bulge-dominated systems. In contrast, disc dominated systems are mainly located in the lower left corner of the relation. The black stars represent fast rotators according to the classification given by Toloba et al. (2014).
Current usage metrics show cumulative count of Article Views (full-text article views including HTML views, PDF and ePub downloads, according to the available data) and Abstracts Views on Vision4Press platform.
Data correspond to usage on the plateform after 2015. The current usage metrics is available 48-96 hours after online publication and is updated daily on week days.
Initial download of the metrics may take a while.


