Fig. 1
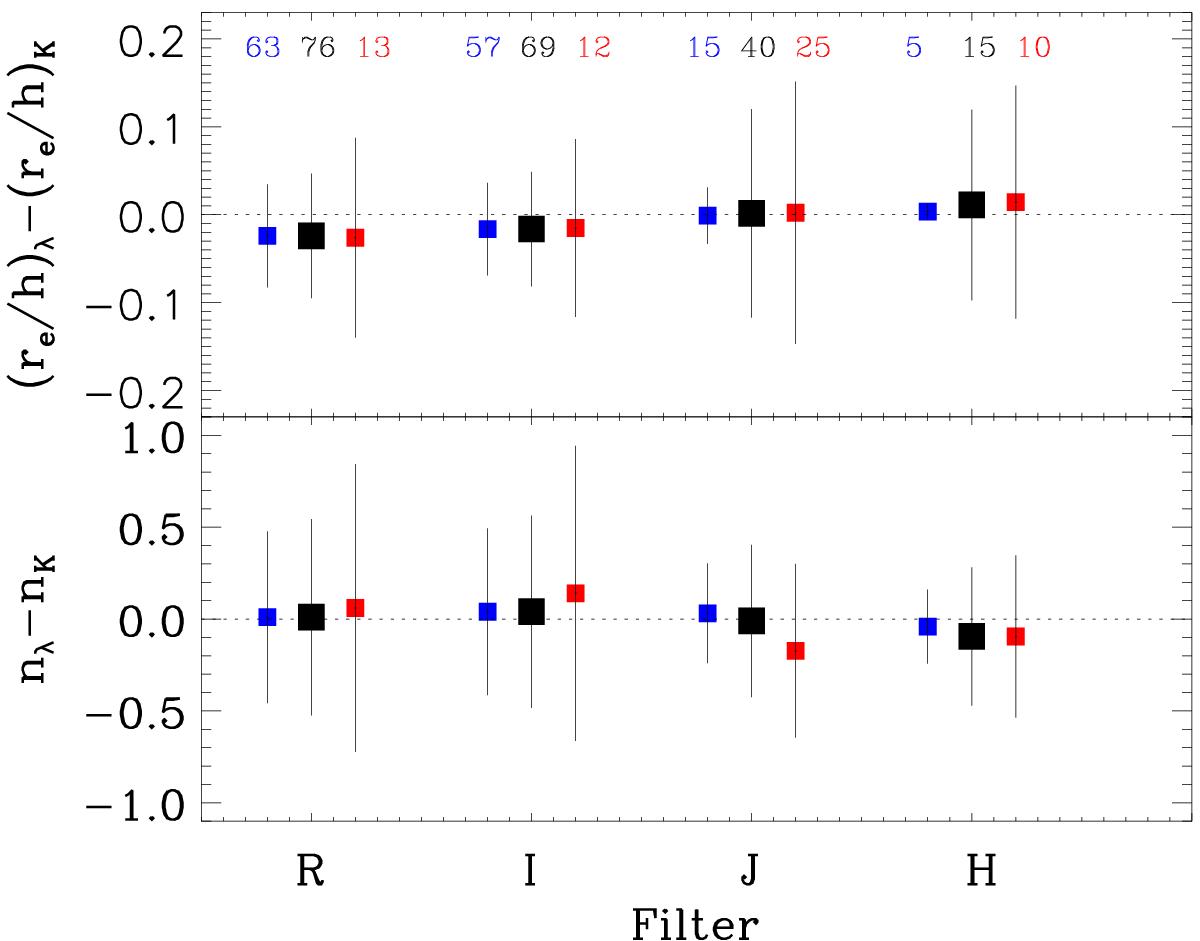
Variation in rb,e/h and n with the bandpass for those galaxies with structural parameters determined in images observed through different wavelengths. Bright galaxies from Graham (2003) and Möllenhoff & Heidt (2001) were used. Black squares represent all galaxies. Blue and red squares show galaxies with bulges showing n< 2 and n> 2, respectively. The numbers located in the top panel indicates the number of total galaxies (black), those with bulges with n> 2 (red) and n< 2 (blue).
Current usage metrics show cumulative count of Article Views (full-text article views including HTML views, PDF and ePub downloads, according to the available data) and Abstracts Views on Vision4Press platform.
Data correspond to usage on the plateform after 2015. The current usage metrics is available 48-96 hours after online publication and is updated daily on week days.
Initial download of the metrics may take a while.