Fig. 11
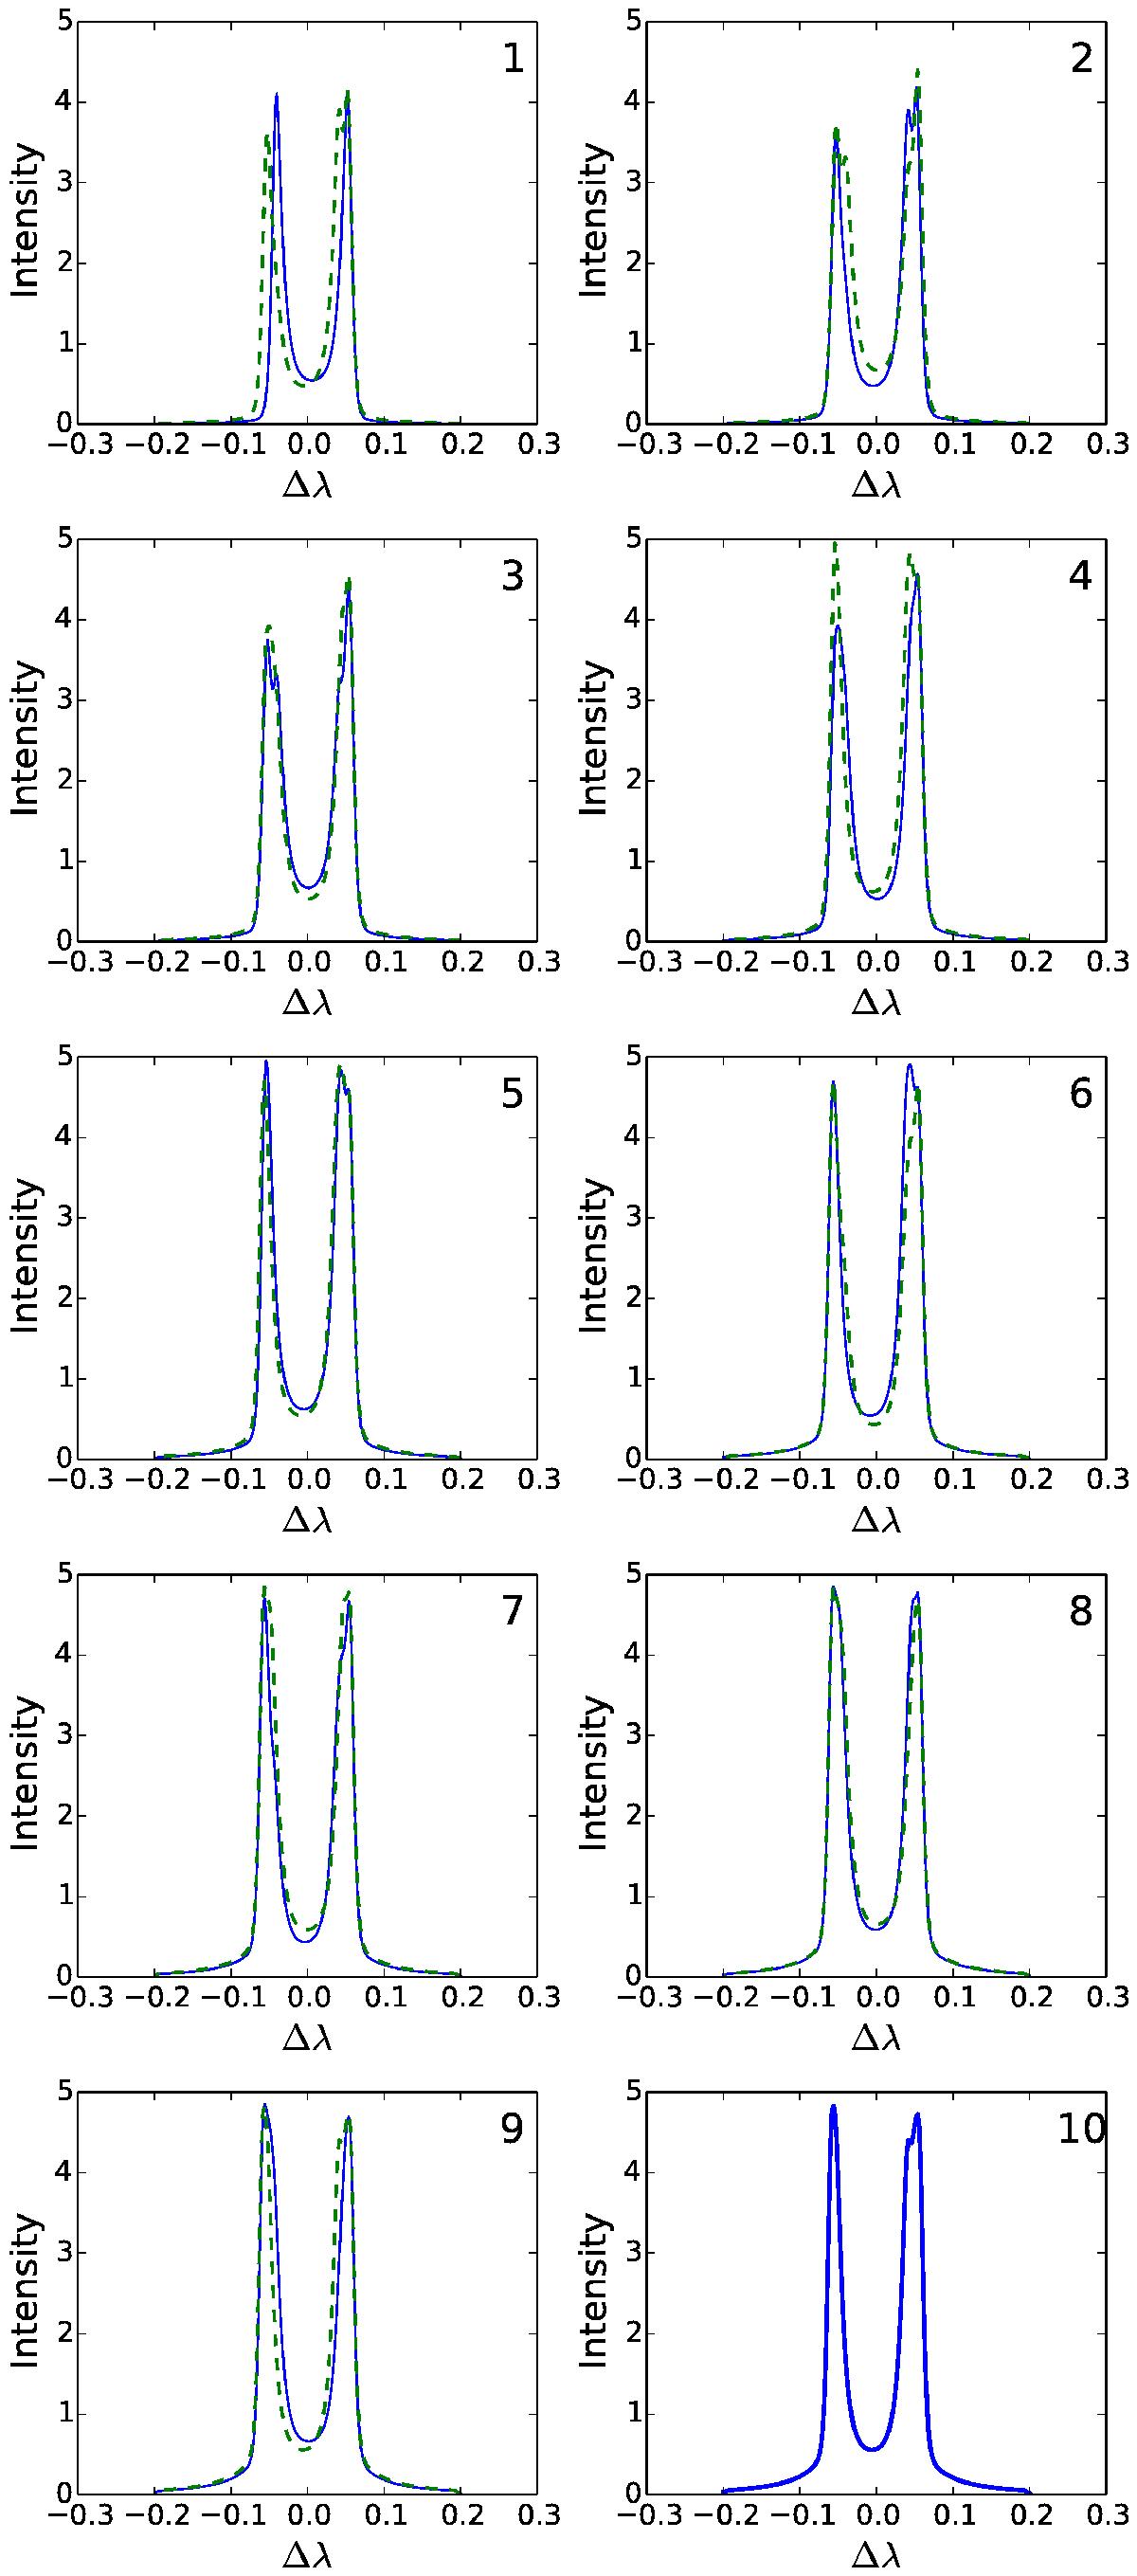
Cumulative effect of randomly moving, randomly positioned threads on the position-averaged emergent intensity for the Lyman α line in a multi-thread model. The solid blue line shows the emergent intensity after N threads. The number of threads is indicated at the top right of each panel. The dashed green line shows the line profile of the (N + 1)th thread in the LOS. The intensity is given in 105 erg s-1 cm-2 sr-1 Å-1. The distance from line centre Δλ is given in Å. The radiation emergent from each thread is computed with the p4 model.
Current usage metrics show cumulative count of Article Views (full-text article views including HTML views, PDF and ePub downloads, according to the available data) and Abstracts Views on Vision4Press platform.
Data correspond to usage on the plateform after 2015. The current usage metrics is available 48-96 hours after online publication and is updated daily on week days.
Initial download of the metrics may take a while.