Fig. 10
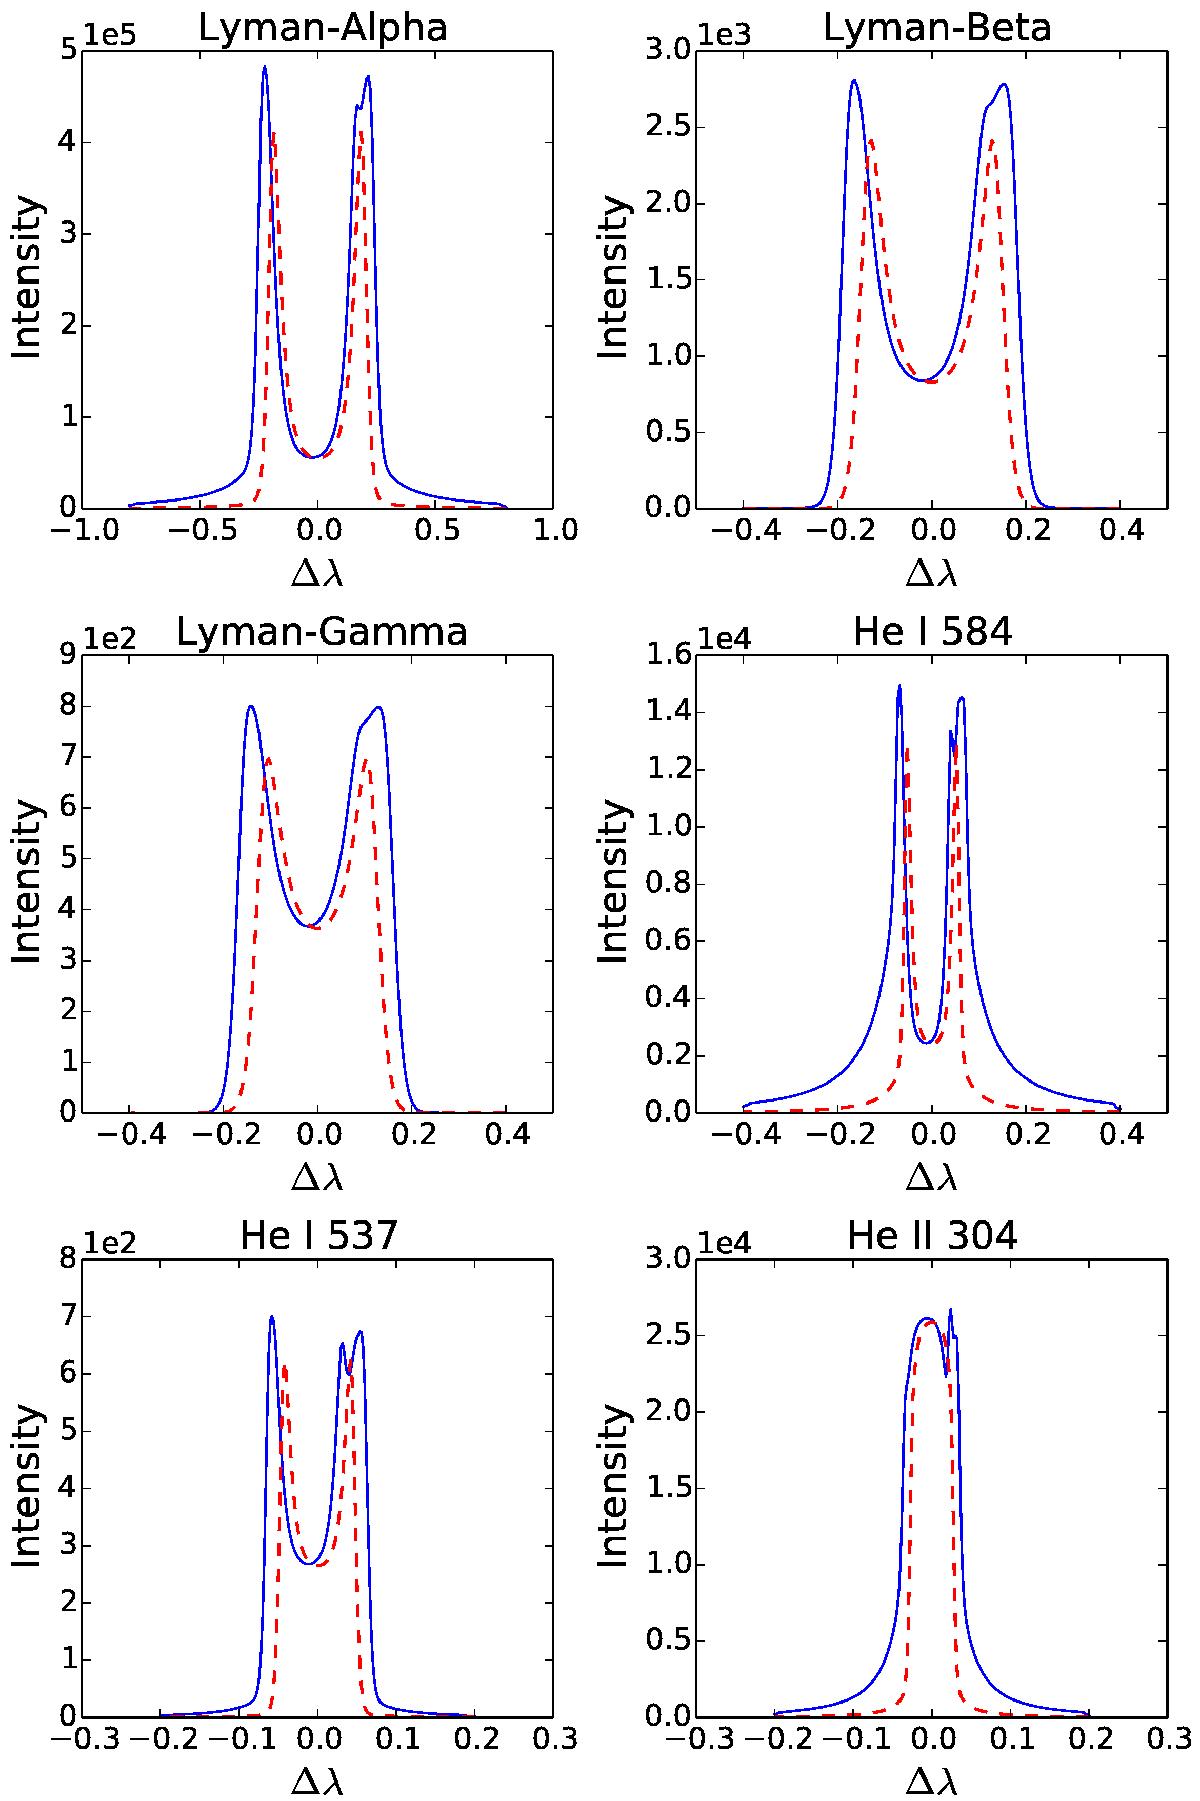
Asymmetrical line profiles of various optically thick hydrogen and helium spectral lines from four unaligned threads with randomly generated velocities. The blue line shows the profile after integration through all four moving threads. The dashed red line shows the profile of a singular, stationary thread. The intensity is given in erg s-1 cm-2 sr-1 Å-1. The number at the top left-hand side of each panel is a multiplication factor for the intensity values. The horizontal axis gives the distance from line centre Δλ in Å. The intensities are spatially averaged over the full field of view defined in Fig. 9.
Current usage metrics show cumulative count of Article Views (full-text article views including HTML views, PDF and ePub downloads, according to the available data) and Abstracts Views on Vision4Press platform.
Data correspond to usage on the plateform after 2015. The current usage metrics is available 48-96 hours after online publication and is updated daily on week days.
Initial download of the metrics may take a while.