Fig. 8
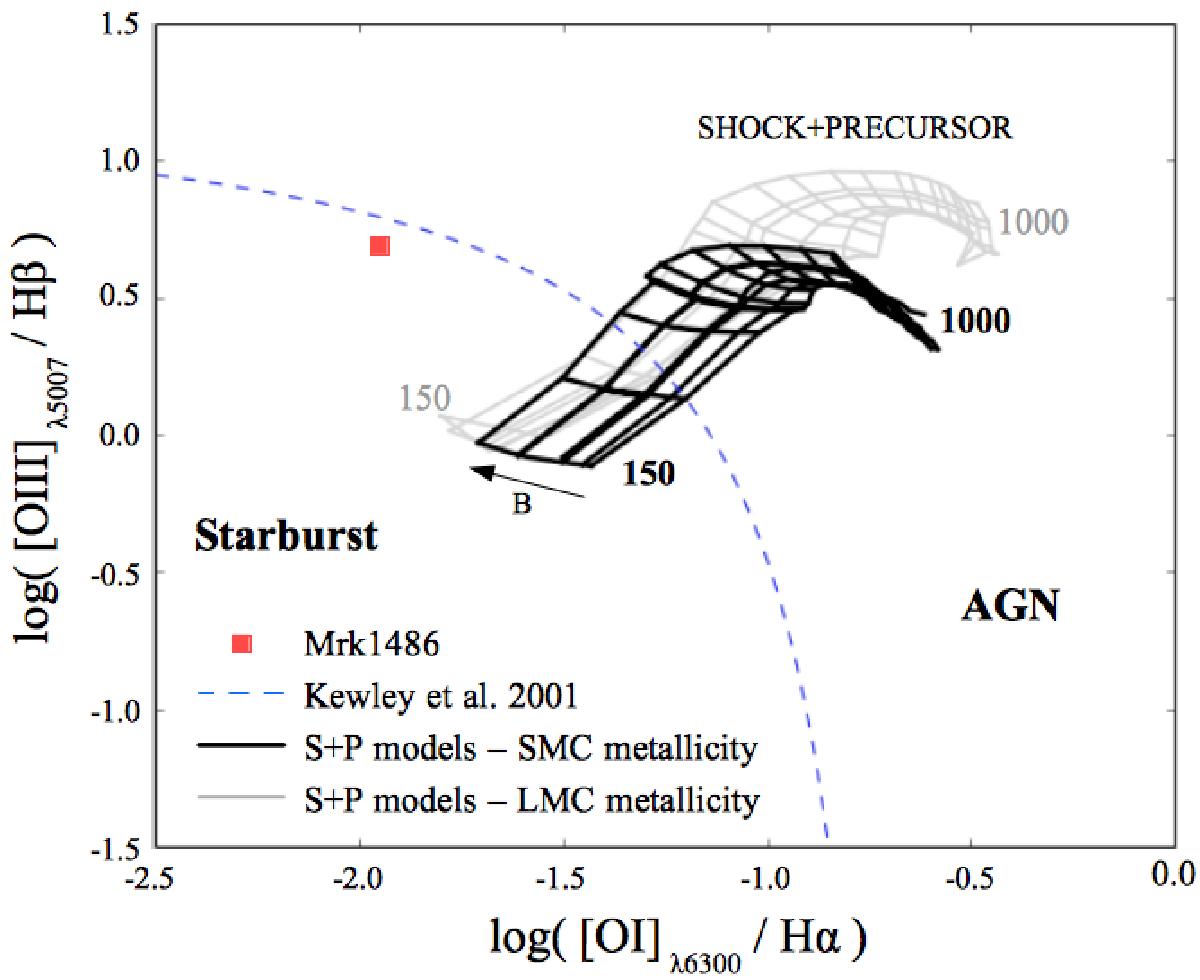
Line diagnostic diagram [OIII]5007/Hβ versus [OI]6300/Hα for Mrk 1486 (the error bars of these line ratios are smaller than the red square). In particular, we compare here the line ratios of these objects to the shock + precursor (S+P) line ratio models of Allen et al. (2008). In all these models, we adopt a very wide range of values for the shock velocity vs (from 150 km s-1 to 1000 km s-1, with a step of 50 km s-1) and the ISM magnetic field B (from 0.5 to 10 νG cm3/2). We also consider the two atomic abundances available that are most similar to the one of Mrk 1486. The thick black zone represents the model grids for the SMC abundance, and the thin gray zone corresponds to the grids for the LMC abundance. The blue dashed line represents the Kewley et al. (2001) starburst/AGN classification line (i.e. the maximum line ratios possible by pure star-forming photoionization).
Current usage metrics show cumulative count of Article Views (full-text article views including HTML views, PDF and ePub downloads, according to the available data) and Abstracts Views on Vision4Press platform.
Data correspond to usage on the plateform after 2015. The current usage metrics is available 48-96 hours after online publication and is updated daily on week days.
Initial download of the metrics may take a while.