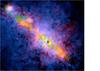
Fig. 2
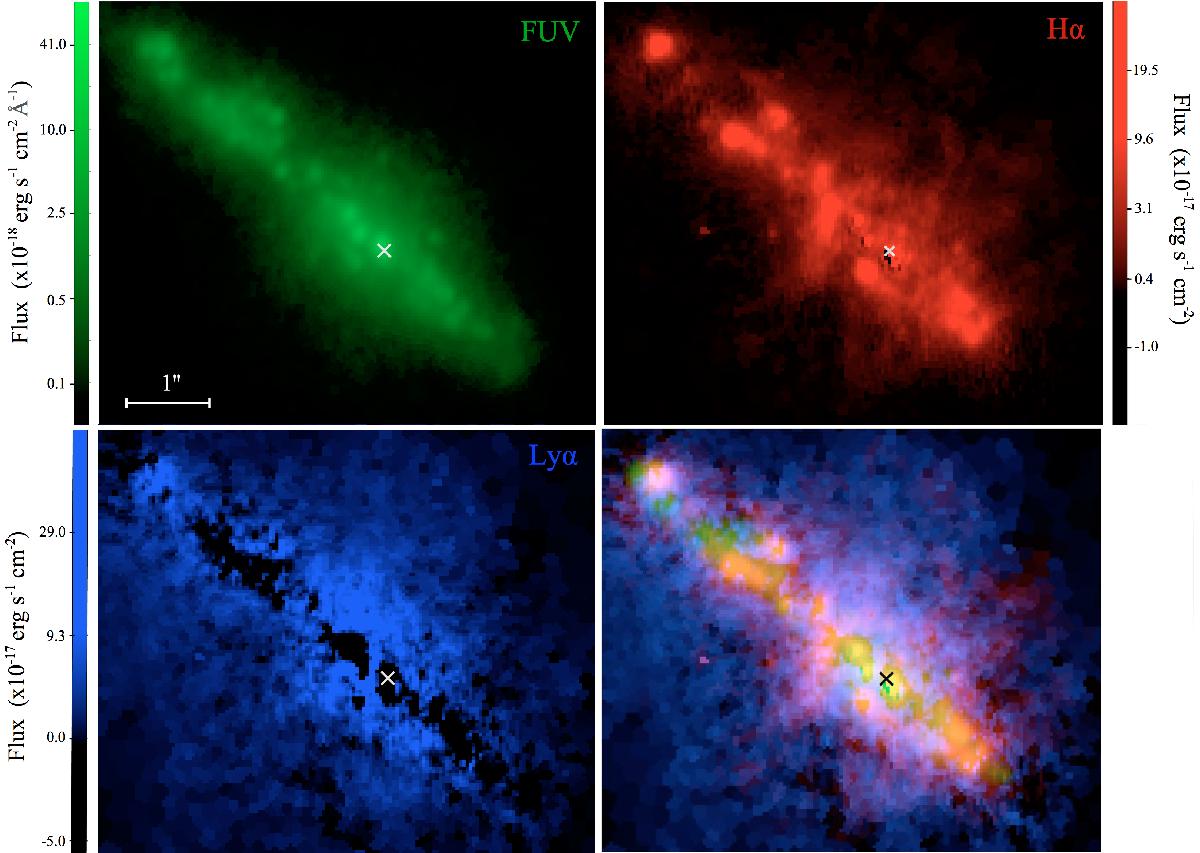
Multiwavelength images of Mrk 1486. The upper left panel shows the UV continuum at a rest-frame wavelength of 1600 Å (image through the SBC/F150LP filter). This emission traces the most massive stars that suffer low dust extinction. The upper right panel shows the continuum-subtracted Hα map of the galaxy. It traces the ionized hydrogen nebulae (as the result of star formation) from which the Hα, Hβ and Lyα photons are produced. The bottom left panel shows the continuum-subtracted Lyα map of Mrk 1486, and the bottom right panel is made by superimposing all images on top of each other. Given the redshift of the galaxy (z ~ 0.0338), 1 arcsec corresponds to 0.67 kpc here. Finally, the cross shown in each panel indicates the position of the brightest UV continuum pixel used as the center of the isophotal area in the right panel of Fig. 3.
Current usage metrics show cumulative count of Article Views (full-text article views including HTML views, PDF and ePub downloads, according to the available data) and Abstracts Views on Vision4Press platform.
Data correspond to usage on the plateform after 2015. The current usage metrics is available 48-96 hours after online publication and is updated daily on week days.
Initial download of the metrics may take a while.