Fig. 18
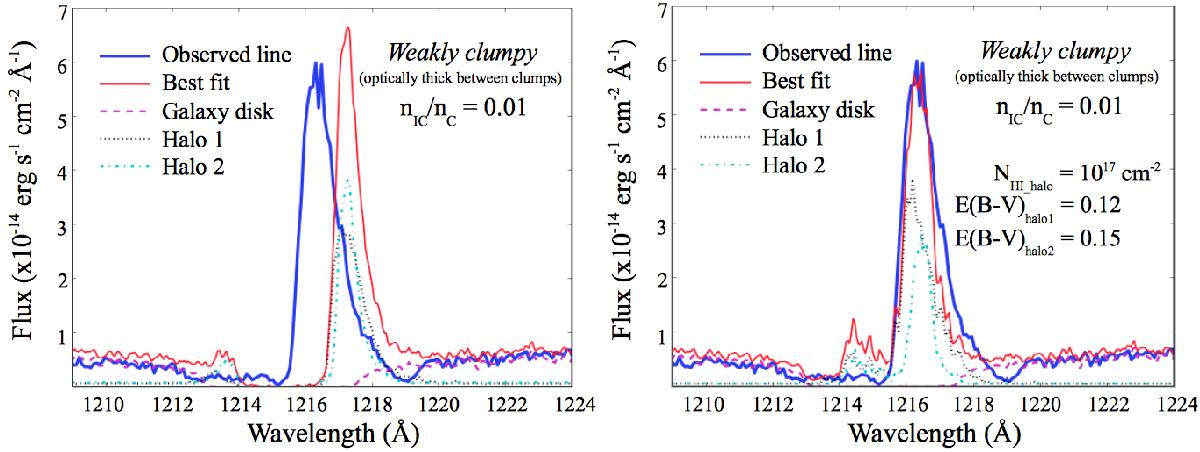
Comparison between the observed Lyα line profile of Mrk 1486 (blue thick line) and the one escaping from our 3D geometry when assuming a weakly clumpy distribution of HI and dust inside the galaxy disk and the outflowing halos (i.e., with an optically thick interclump medium, nIC/nC = 0.01). The magenta dashed line shows the spectrum that escapes from the galaxy disk. The spectra of halo 1 and halo 2 are shown as a black dotted line and blue dashed-dotted line, respectively. Left panel: the red thin line shows the Lyα line profile escaping from our 3D geometry when adopting the fit parameters listed in Table 7. Under these conditions, we note a clear shift of the blue and red bump peaks that is due to the transfer of Lyα photons in the very warm interclump medium (T = 106 K, which leads to a broader Voigt absorption profile for Lyα). Right panel: the red thin line shows our best fit of the observed Lyα line profile when adopting new ![]() and
and ![]() for the two outflowing halos of our 3D geometry. We find here an HI column density
for the two outflowing halos of our 3D geometry. We find here an HI column density ![]() = 1017 cm-2 for each wind and a color excess E(B − V) = 0.12 and 0.15 for halo 1 and halo 2, respectively.
= 1017 cm-2 for each wind and a color excess E(B − V) = 0.12 and 0.15 for halo 1 and halo 2, respectively.
Current usage metrics show cumulative count of Article Views (full-text article views including HTML views, PDF and ePub downloads, according to the available data) and Abstracts Views on Vision4Press platform.
Data correspond to usage on the plateform after 2015. The current usage metrics is available 48-96 hours after online publication and is updated daily on week days.
Initial download of the metrics may take a while.