Fig. 17
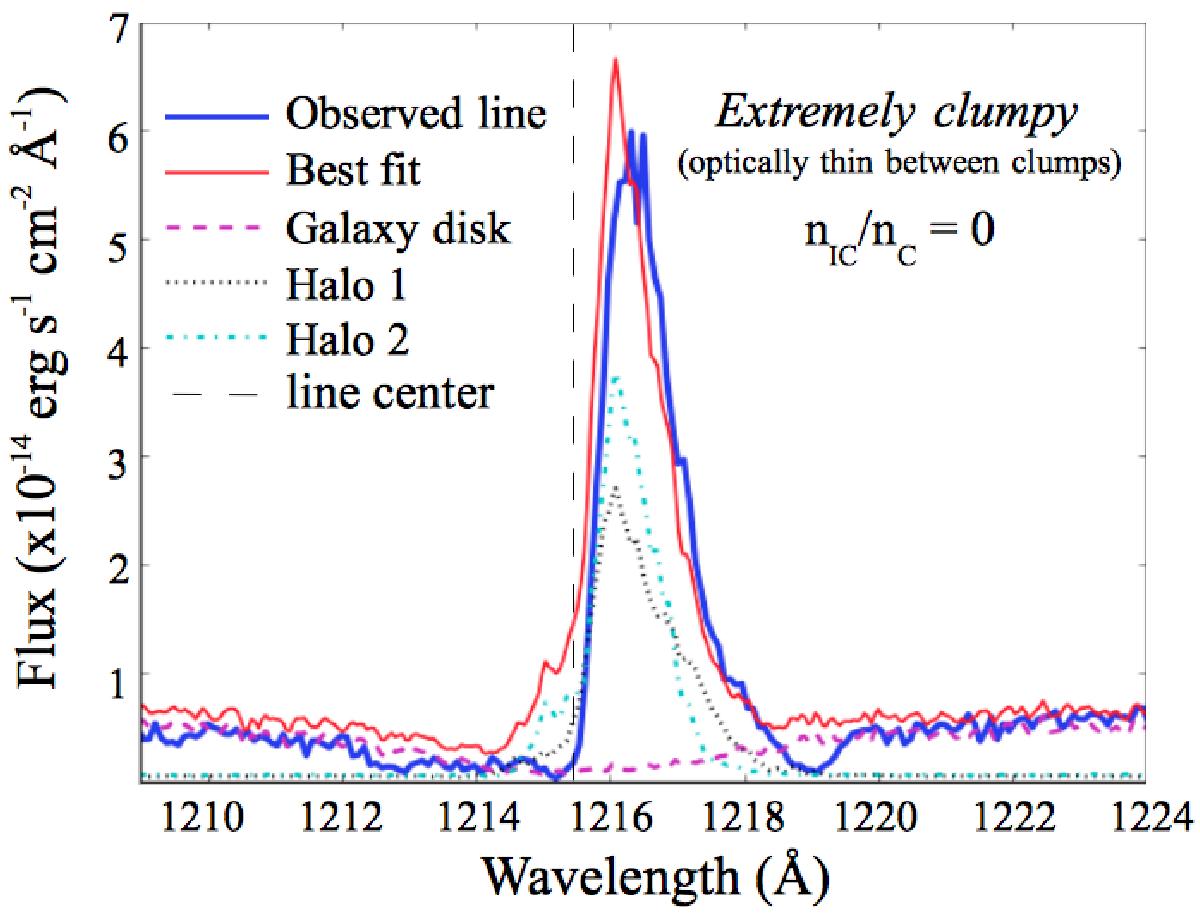
Comparison between the observed Lyα line profile of Mrk 1486 (blue thick line) and the one escaping from our 3D geometry when assuming an extremely clumpy distribution of HI and dust inside the galaxy disk and the outflowing halos (i.e., with an optically thin interclump medium, nIC/nC = 0). The magenta dashed line shows the spectrum that escapes from the galaxy disk. The spectra of wind 1 and wind 2 are shown as a black dotted and a blue dashed-dotted line, respectively. When assuming nIC/nC = 0 in each component, we always obtain a strong emission at the Lyα line center.
Current usage metrics show cumulative count of Article Views (full-text article views including HTML views, PDF and ePub downloads, according to the available data) and Abstracts Views on Vision4Press platform.
Data correspond to usage on the plateform after 2015. The current usage metrics is available 48-96 hours after online publication and is updated daily on week days.
Initial download of the metrics may take a while.