Fig. 15
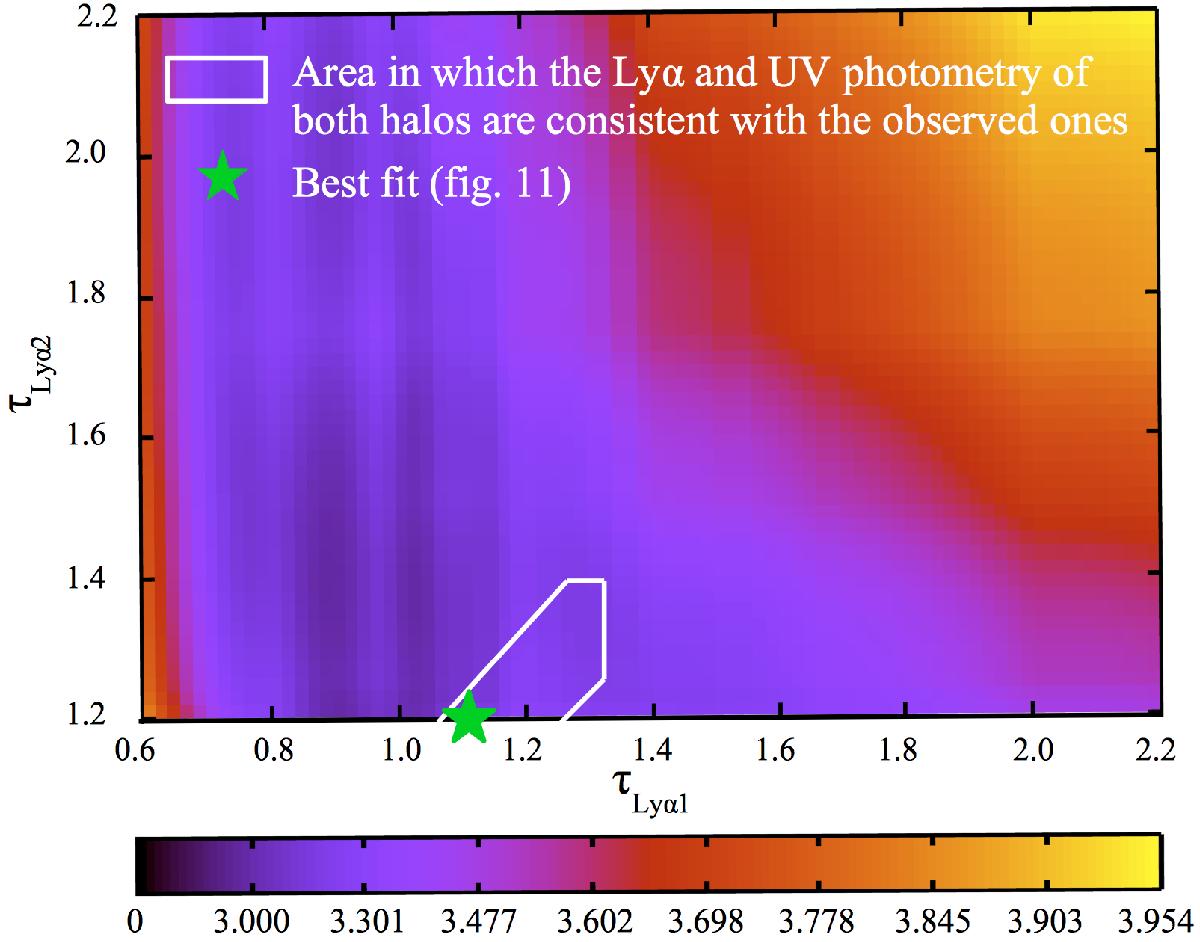
log(χ2) map for the Lyα line fit with three components (disk, halo 1, and halo 2). Here we vary only the dust optical depth of each outflowing halo: τLyα1 and τLyα2. While the intrinsic Lyα equivalent width is allowed to vary from 77 Å to 130 Å, all other physical parameters do not change (we use those listed in Table 7). A degeneracy is clearly seen (darkest zones), running diagonally for the lowest τLyα1 values. The white area shows the range for τLyα1 and τLyα2 from which the strength of each line component (halos 1 and 2) are consistent with the one observed from the HST imaging (see Table 2): halo 1 and halo 2 contribute up to 56![]() % and 44
% and 44![]() % of the total Lyα flux and up to 11
% of the total Lyα flux and up to 11![]() % and 12
% and 12![]() % of the total UV continuum flux, respectively.
% of the total UV continuum flux, respectively.
Current usage metrics show cumulative count of Article Views (full-text article views including HTML views, PDF and ePub downloads, according to the available data) and Abstracts Views on Vision4Press platform.
Data correspond to usage on the plateform after 2015. The current usage metrics is available 48-96 hours after online publication and is updated daily on week days.
Initial download of the metrics may take a while.