Fig. 11
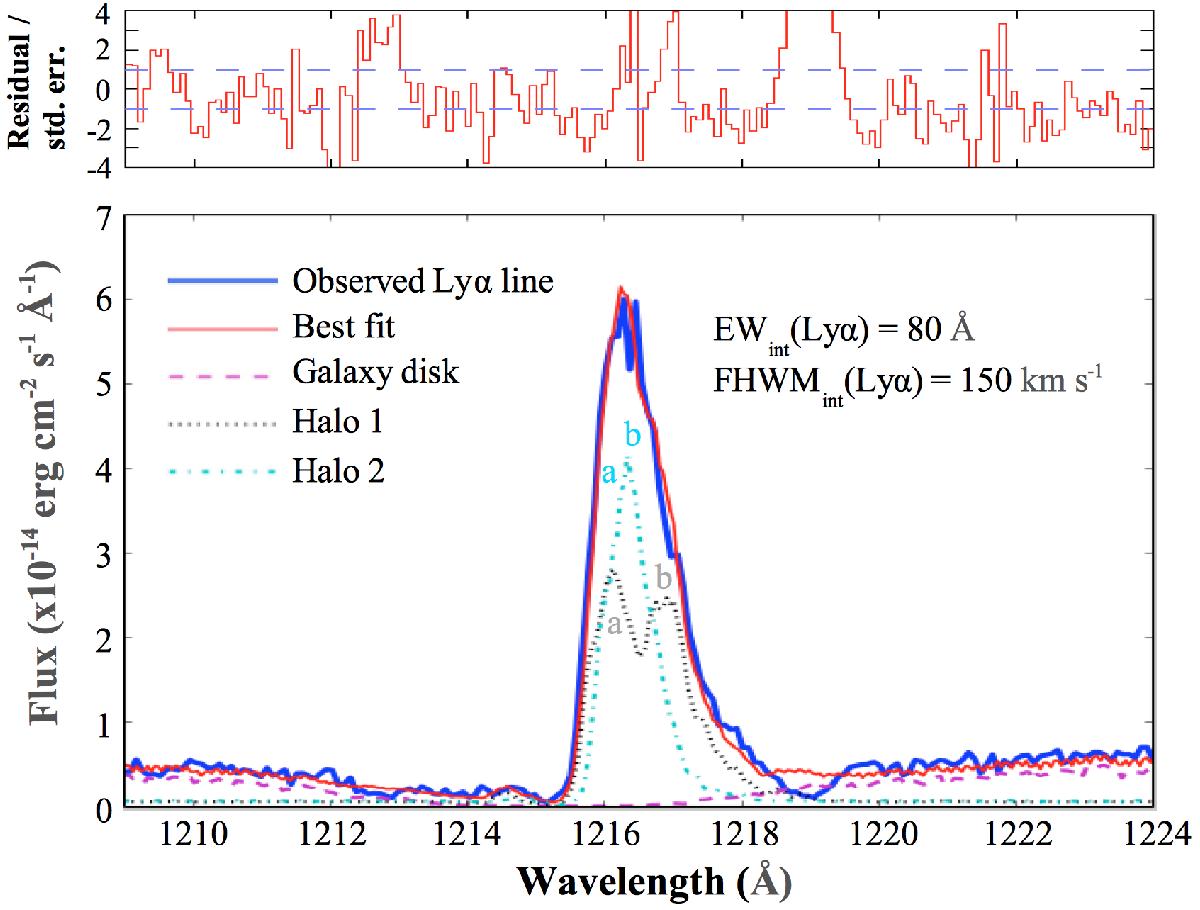
Best Lyα line fit of Mrk 1486. Lower panel: the blue lines correspond to the observed Lyα line of Mrk 1486, the red line represents our best fit. Three components are included in this composite line. The magenta dashed line shows the spectrum that escapes from the galaxy disk. The components of halo 1 and halo 2 are shown as a black dotted and a blue dashed-dotted line, respectively. The letters “a” and “b” refer to Fig. 16: bump “a” is formed by Lyα photons that escape without experiencing any backscattering, while bump “b” is formed by Lyα photons that undergo one backscattering event. Upper panel: for each wavelength bin, we plot the residual over the standard deviation between the observed Lyα line and our best fit. The blue dashed lines correspond to 1σ deviation. Inside the wavelength range of the Lyα line, 70% of the data points lie inside the 1σ deviation region.
Current usage metrics show cumulative count of Article Views (full-text article views including HTML views, PDF and ePub downloads, according to the available data) and Abstracts Views on Vision4Press platform.
Data correspond to usage on the plateform after 2015. The current usage metrics is available 48-96 hours after online publication and is updated daily on week days.
Initial download of the metrics may take a while.