Fig. 10
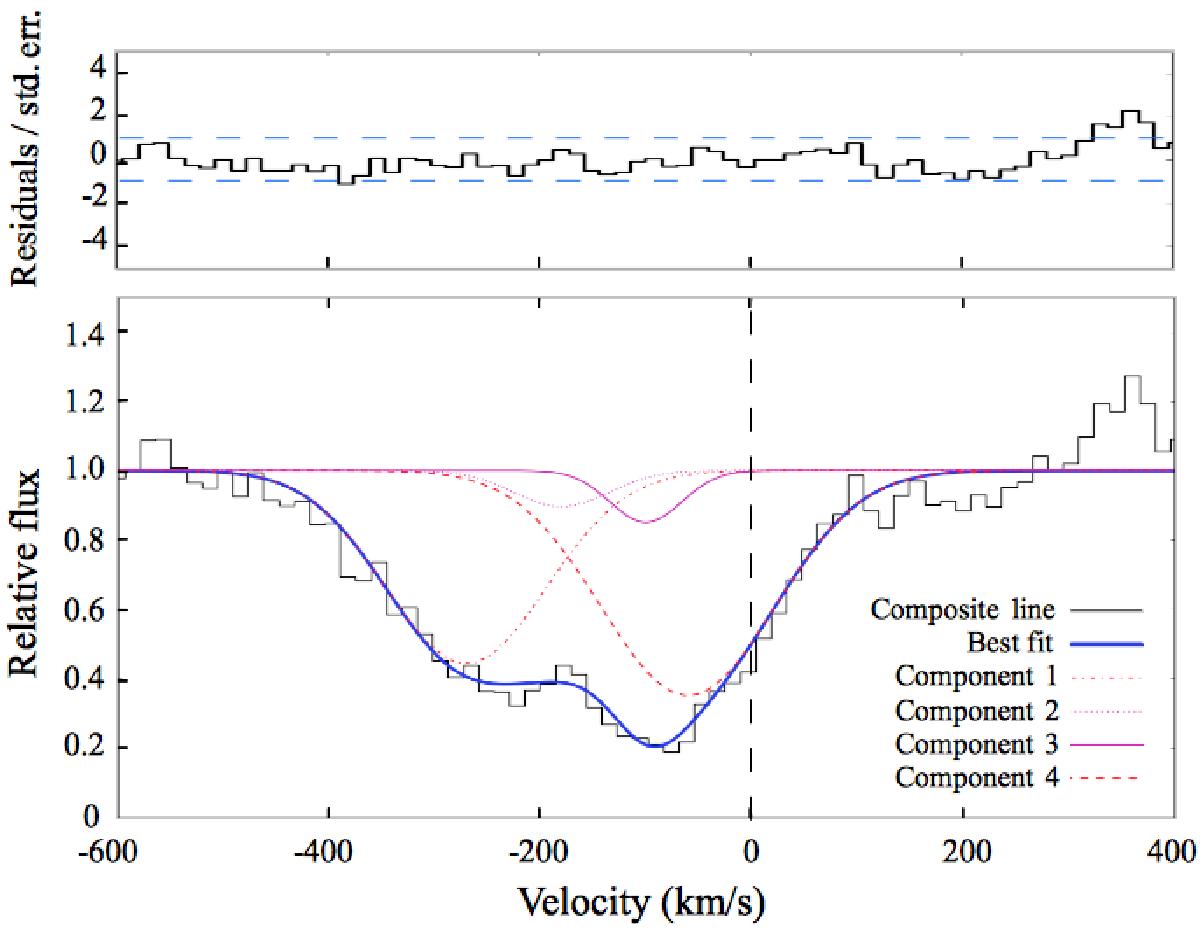
Bottom panel: composite line profile of four SiII absorption lines observed in the COS spectrum of Mrk 1486 (Rivera-Thorsen et al. 2015): λ = 1190 Å, λ = 1193 Å, λ = 1260 Å, and λ = 1304 Å. These lines all arise from the same ground state. The composite spectrum is transformed here in velocity space using the observed wavelength of stellar lines. Only in this figure, outflows show negative and inflows positive velocities. Upper panel: for each velocity bin, we plot the residual over the standard deviation between the observed SiII line and our best fit. The blue dashed lines correspond to 1σ deviation.
Current usage metrics show cumulative count of Article Views (full-text article views including HTML views, PDF and ePub downloads, according to the available data) and Abstracts Views on Vision4Press platform.
Data correspond to usage on the plateform after 2015. The current usage metrics is available 48-96 hours after online publication and is updated daily on week days.
Initial download of the metrics may take a while.