Fig. 7
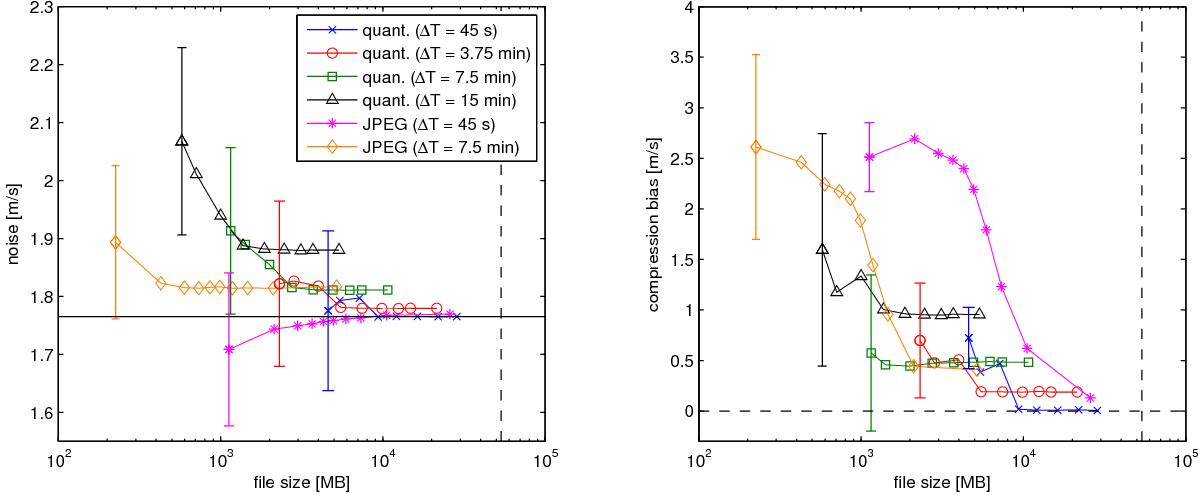
Noise level (left) and absolute value of the compression bias (right) averaged over latitude (not including the data centered at 10° latitude) as a function of file size for different compression methods. The different curves correspond to the different compression methods (quantization and JPEG) and to data with different time lags Δt between consecutive pairs of images. Blue crosses: quantization with ΔT = 45 s; red circle: quantization with ΔT = 3.75 min; green squares: quantization with ΔT = 7.5 min; black triangles: quantization with ΔT = 15 min; purple asterisks: JPEG compression with ΔT = 45 s; and orange diamonds: JPEG compression with ΔT = 7.5 min. Along the curves, we vary the number n of possible values for the intensity for quantization or the quality factor q for JPEG compression. The file size represents the file size necessary for measuring differential rotation as in Fig. 5 (T = 120 days). The horizontal line in the left panel represents the noise level averaged over latitude for uncompressed data (T = 120 days). The vertical line shows the size of the uncompressed data (assuming a size of 7.1 bits per pixel for the HMI raw data). For clarity, we only show one error bar for each curve. We only show results for short time lags. Larger time lags cause significantly higher compression bias and noise level.
Current usage metrics show cumulative count of Article Views (full-text article views including HTML views, PDF and ePub downloads, according to the available data) and Abstracts Views on Vision4Press platform.
Data correspond to usage on the plateform after 2015. The current usage metrics is available 48-96 hours after online publication and is updated daily on week days.
Initial download of the metrics may take a while.