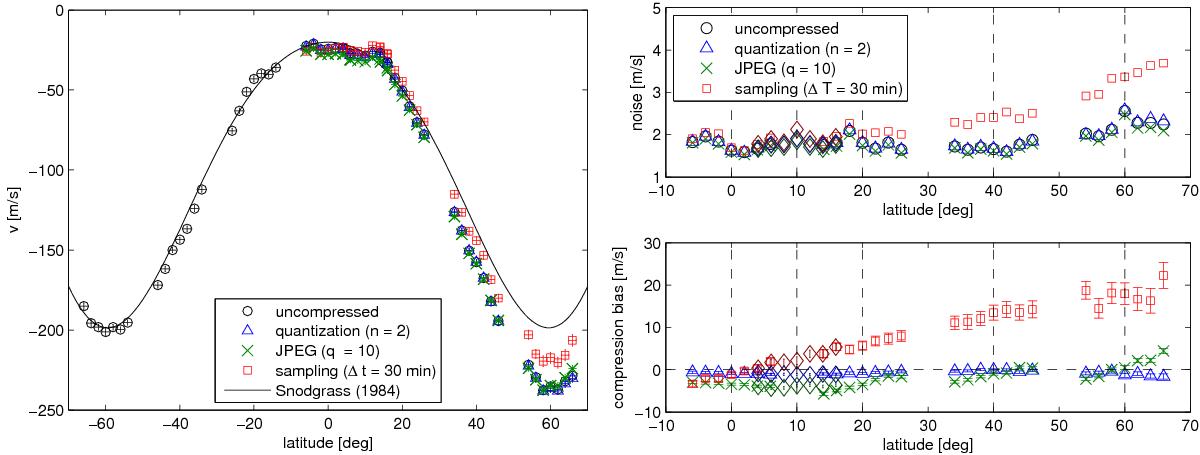
Fig. 5

Left: differential rotation relative to solid body rotation determined using LCT on uncompressed and compressed data (T = 120 days). Black circles: uncompressed data; blue triangles: quantization (n = 2); green crosses: JPEG (quality = 10); red squares: large time lag between consecutive velocity maps (ΔT = 30 min). The solid curve is the Snodgrass (1984) rotation rate, which is used by the tracking code. We only computed the rotation rate for positive latitudes with compressed data to save computation time. In the northern hemisphere, there is a large (up to ~34 m/s) offset between the Snodgrass (1984) rate and velocities derived using LCT. Its origin is unknown. The error bars are smaller than the symbol size. Right: noise level (top) and compression bias (difference compressed minus uncompressed data, bottom) as a function of latitude for the differential rotation curve shown on the left. The vertical dashed lines show the centers of the tracked and remapped intensity images. The diamonds show the noise and bias derived from intensity data centered at 10° latitude, overlapping with the data centered at 0° and 20° latitude. The time lag method suffers from a large compression bias that increases linearly with latitude. Quantization and JPEG are in good agreement with the uncompressed case.
Current usage metrics show cumulative count of Article Views (full-text article views including HTML views, PDF and ePub downloads, according to the available data) and Abstracts Views on Vision4Press platform.
Data correspond to usage on the plateform after 2015. The current usage metrics is available 48-96 hours after online publication and is updated daily on week days.
Initial download of the metrics may take a while.


