Fig. 4
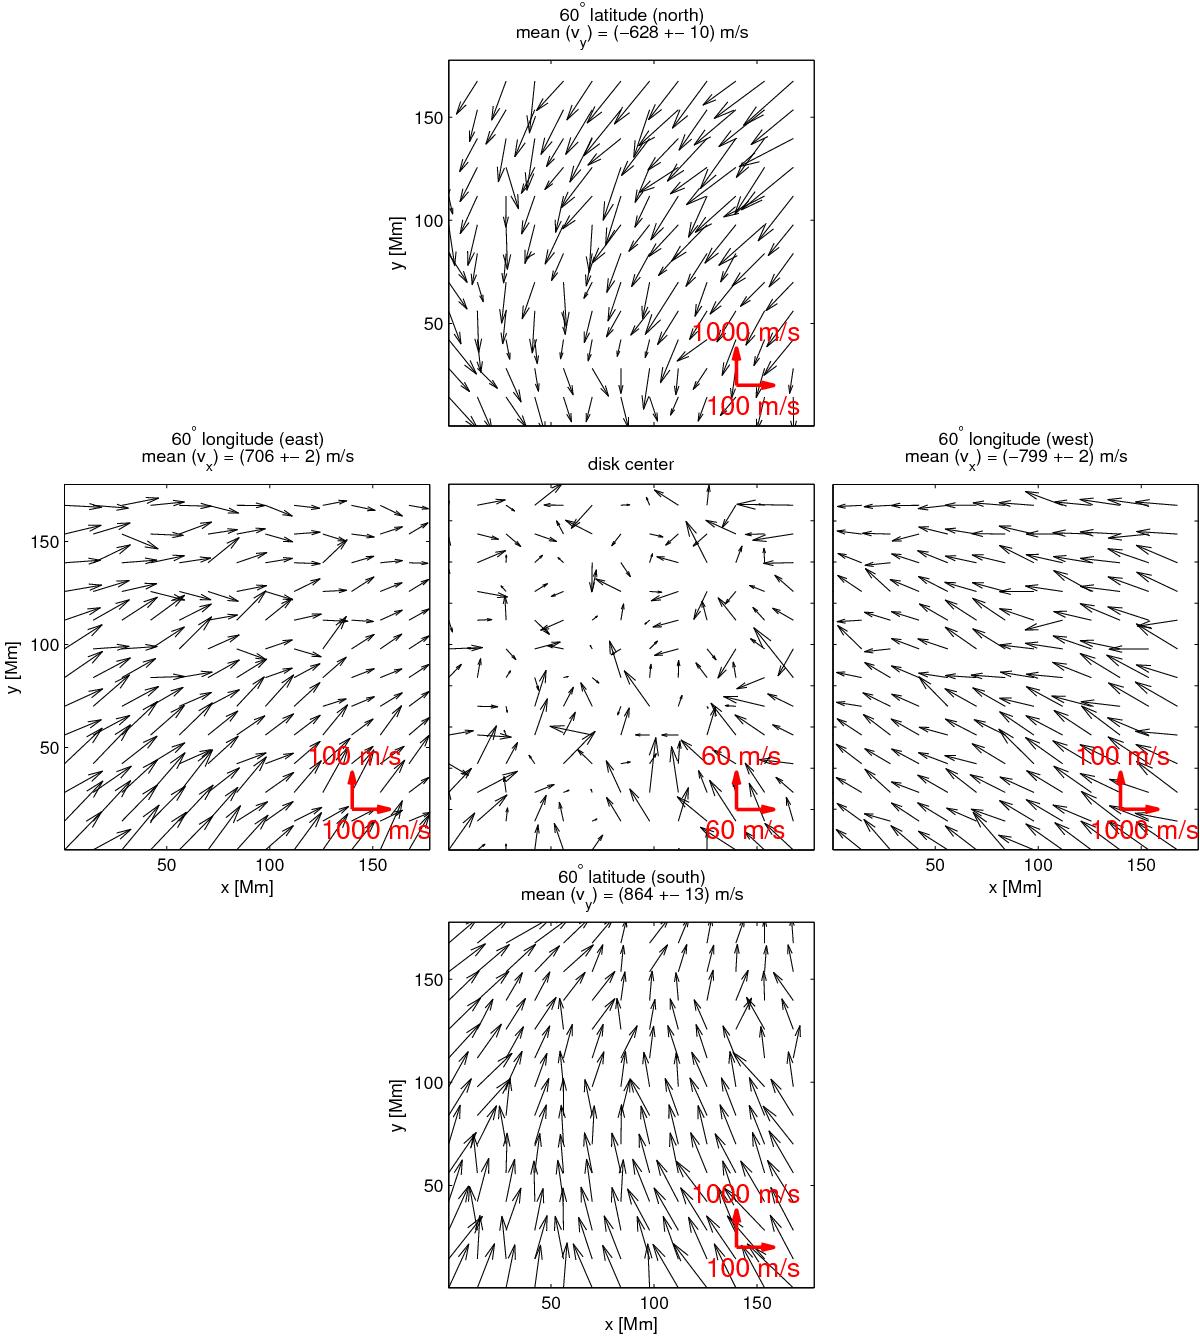
Vector velocities derived by LCT averaged over 120 days for several positions on the disk. Top: velocities at 60° latitude north at the central meridian; bottom: 60° latitude south at the central meridian; left: 60° longitude east at the equator; center: 0° latitude and 0° longitude; and right: 60° longitude west at the equator. The scaling of the arrows (shown in the bottom right in the individual images) for the plot at disk center is different from the others. The range of the velocities varies significantly over the disk because of different magnitudes of the shrinking-Sun effect. We amplify the flows in the azimuthal direction (vx for 60° latitude north and south and vy for 60° longitude east and west) by a factor of ten when displaying the arrows. The mean values of the velocities in radial direction are shown above the individual images. The amplitude of the shrinking-Sun effect is different for 60° latitude north and south. This is caused by the B0 angle. It is mostly positive and increases from −4° to + 7° over the course of the 120 days that we have studied. There is also a difference of (93 ± 3) m/s in the amplitude of the shrinking-Sun effect between 60° longitude east and west. The reason for this is not understood yet. At the equator, the velocities in the y direction caused by the shrinking-Sun effect point predominantly north due to the mostly positive B0 angle.
Current usage metrics show cumulative count of Article Views (full-text article views including HTML views, PDF and ePub downloads, according to the available data) and Abstracts Views on Vision4Press platform.
Data correspond to usage on the plateform after 2015. The current usage metrics is available 48-96 hours after online publication and is updated daily on week days.
Initial download of the metrics may take a while.