Fig. 3
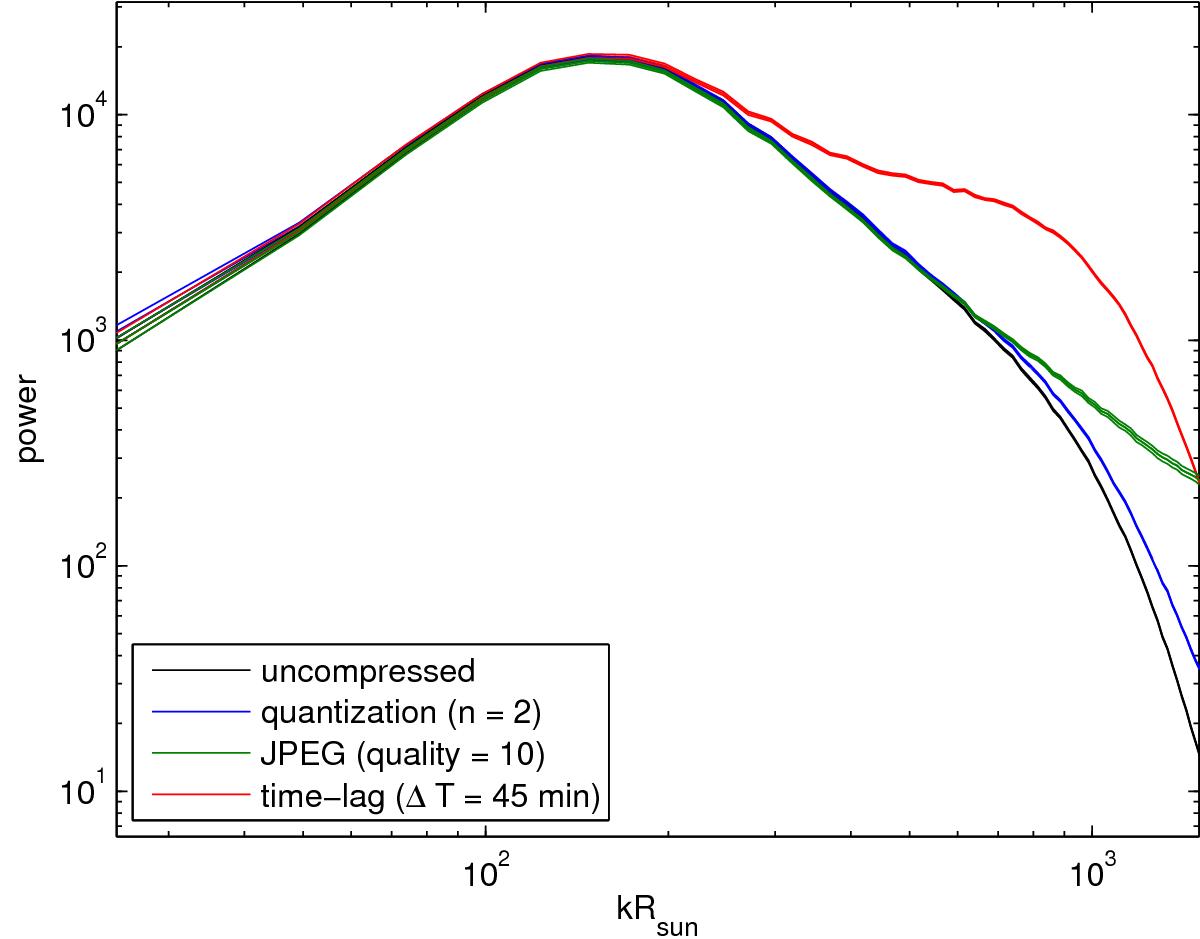
Spatial power spectra of the flow divergence at disk center (averaged power for T = 120 days). Black: uncompressed data; blue: quantization (n = 2); green: JPEG (quality = 10); red: large time lag between consecutive velocity maps (ΔT = 45 min). The thickness of the lines shows the 1σ scatter of the mean power. All curves exhibit a peak at kR⊙ ≈ 120 resulting from supergranulation. At high wavenumbers, the additional noise introduced by the compression is visible. A large time lag between consecutive velocity maps does not remove all the noise from granulation. Quantization and JPEG lead to noise on a pixel-by-pixel scale, since JPEG is worse than quantization. At supergranulation scales, the influence of quantization and JPEG compression is negligible.
Current usage metrics show cumulative count of Article Views (full-text article views including HTML views, PDF and ePub downloads, according to the available data) and Abstracts Views on Vision4Press platform.
Data correspond to usage on the plateform after 2015. The current usage metrics is available 48-96 hours after online publication and is updated daily on week days.
Initial download of the metrics may take a while.