Fig. 2
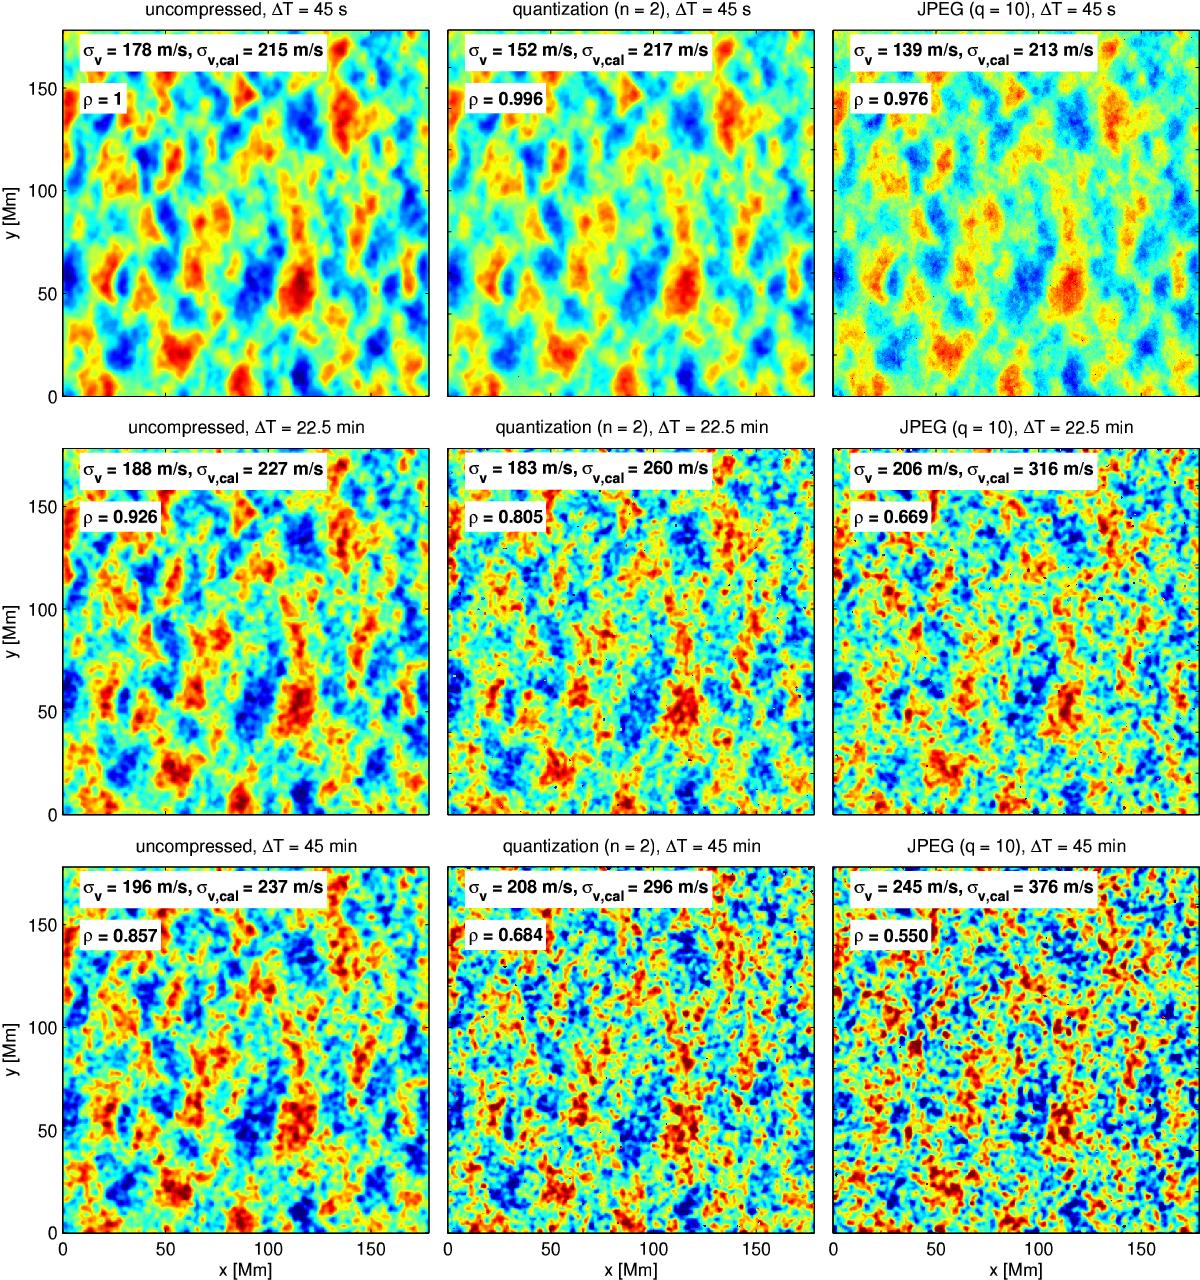
Flows in the x direction at disk center, as determined by local correlation tracking of granulation (averaged over 24 h). We compare a flow map for uncompressed data with flow maps for different compression methods. Left column: uncompressed data; middle column: quantization (n = 2); right column: JPEG (quality = 10). In the vertical direction, we vary the time lag ΔT between consecutive velocity maps used for averaging over 24 h (top row: ΔT = 45 s; middle row: ΔT = 22.5 min; bottom row: ΔT = 45 min). All flow maps clearly show supergranulation. We use the same scaling of the color map for all images, corresponding to the amplitudes of the velocities before applying the calibration factor. The numbers in the images give the standard deviation of the velocities before (σv) and after (σv,cal) applying the calibration factor to the data and the correlation with the LCT maps computed from uncompressed data (ρ). The flow maps computed from compressed data have a higher noise level than those for uncompressed data. Quantization and JPEG lead to noise in the cross-covariances used by the LCT code and, thus, results in noise that varies on a pixel-by-pixel scale. The JPEG compression causes a higher noise level than quantization. A large time lag between consecutive velocity maps causes granulation noise to remain visible in the image.
Current usage metrics show cumulative count of Article Views (full-text article views including HTML views, PDF and ePub downloads, according to the available data) and Abstracts Views on Vision4Press platform.
Data correspond to usage on the plateform after 2015. The current usage metrics is available 48-96 hours after online publication and is updated daily on week days.
Initial download of the metrics may take a while.