Fig. 1
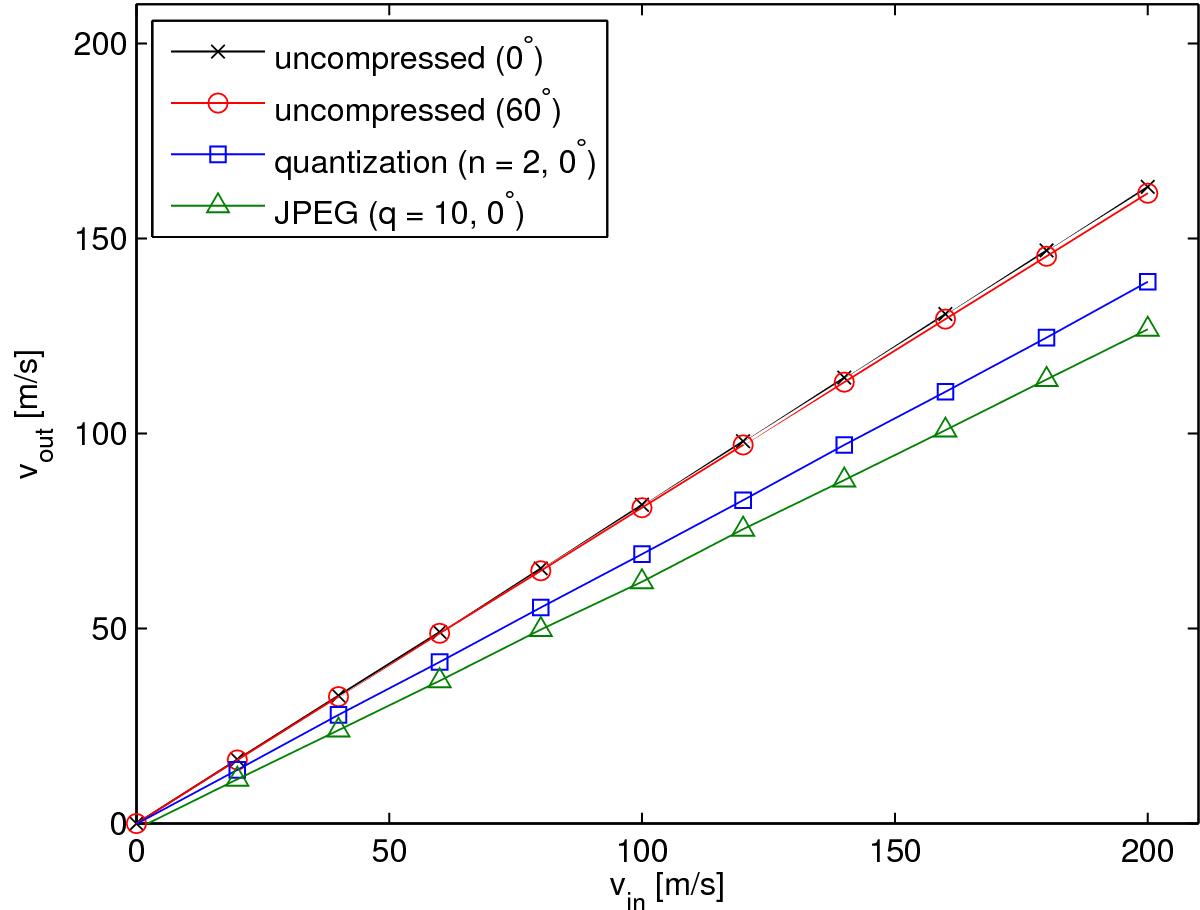
Calibration curves for LCT. Black crosses: uncompressed data at 0° latitude; red circles: uncompressed data at 60° latitude; blue squares: quantized data (n = 2) at 0° latitude; green triangles: JPEG compression (q = 2) at 0° latitude. The error bars are smaller than the symbol size. The amplitudes of the velocities generated by LCT are in general lower than the actual velocities on the Sun, especially for compressed data. We correct for this effect by generating calibration data with a constant flow in the x direction. Three days of data are used for each data point. For more details about this method, see the text.
Current usage metrics show cumulative count of Article Views (full-text article views including HTML views, PDF and ePub downloads, according to the available data) and Abstracts Views on Vision4Press platform.
Data correspond to usage on the plateform after 2015. The current usage metrics is available 48-96 hours after online publication and is updated daily on week days.
Initial download of the metrics may take a while.