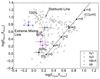
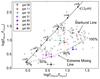
Fig. 6

Far-infrared colour–colour diagrams, modified from Kewley et al. (2000). Top: log (f60 μm/f25 μm) vs. log (f25 μm/f12 μm) diagram. Bottom: log (f60 μm/f12 μm) vs. log (f100 μm/f25 μm) diagram. In both plots, the solid line is the reddening line calculated by Dopita et al. (1998). The straight dashed line marks the typical area of starbursts. The “extreme mixing line” corresponds to the mixture of a typical Seyfert-1 spectrum and a starburst component (with denoted percentage). The open symbols are Seyfert-1, starburst, and Seyfert-2 galaxies with (HBLR) and without (Sy2) broad-line components observed in polarised light, taken from the sample of Rush et al. (1993). The positions of the analysed galaxies are indicated by the coloured data points.
Current usage metrics show cumulative count of Article Views (full-text article views including HTML views, PDF and ePub downloads, according to the available data) and Abstracts Views on Vision4Press platform.
Data correspond to usage on the plateform after 2015. The current usage metrics is available 48-96 hours after online publication and is updated daily on week days.
Initial download of the metrics may take a while.