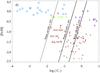
Fig. 6
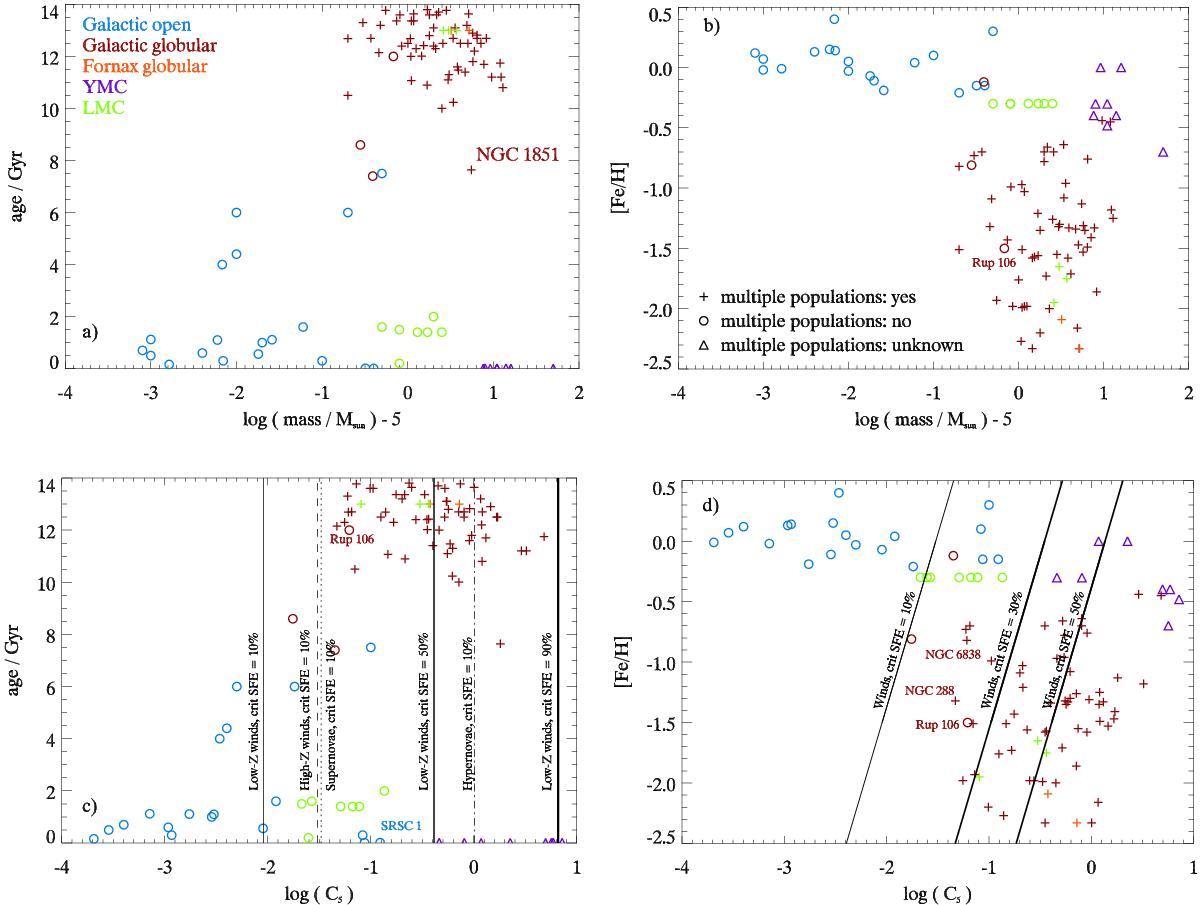
Star clusters from Tables 1 and B.1 in different parameter spaces. Different symbols are used according to the presence of multiple populations, as indicated either from photometry or spectroscopic abundance analysis: we indicate star clusters that have been searched for multiple populations but with negative result (open circles), with positive result (plus signs), and clusters where the presence of multiple populations is not known (triangles). The colours code different samples: GCs: dark red, Fornax globular clusters: light red, YMCs: purple, LMC clusters: green, Galactic open clusters: blue. Some star clusters discussed in the text are highlighted. a) Mass-age diagram. b) Mass-metallicity diagram. c) Compactness-age diagram. Black vertical lines indicate the critical star formation efficiency required to expel the remaining gas as calculated in the present work. Solid lines are for the low-metallicity stellar winds models (thin: 10 per cent, medium: 50 per cent, thick: 90 per cent). Other lines are for 10 per cent critical star formation efficiency; the dashed line for solar metallicity winds, the dotted line for normal supernovae, and the dot-dashed line for hypernovae of 1053 erg, each. d) Compactness-metallicity diagram. Solid lines separate regions where gas expulsion is possible with the indicated star formation efficiency (left) from regions where this is not possible (right), according to the present work, for the case of metallicity dependent stellar winds.
Current usage metrics show cumulative count of Article Views (full-text article views including HTML views, PDF and ePub downloads, according to the available data) and Abstracts Views on Vision4Press platform.
Data correspond to usage on the plateform after 2015. The current usage metrics is available 48-96 hours after online publication and is updated daily on week days.
Initial download of the metrics may take a while.