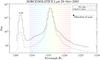
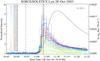
Fig. 3

Top panel: Lyα line profile observed by SORCE/SOLSTICE before (dashed curve) and during (solid curve) the 28 October 2003 flare. Also visible is the nearby Si III line. The vertical coloured lines denote the wavelengths of the lightcurves in the bottom panel. Bottom panel: lightcurves at different wavelengths of the Lyα line during the 28 October 2003 flare. The time profiles of the neighbouring Si III line is also shown as a grey histogram. The vertical dashed and solid lines denote the approximate times of the pre-flare and flare spectra in the top panel, respectively. The GOES SXR lightcurve (black) is also shown for context.
Current usage metrics show cumulative count of Article Views (full-text article views including HTML views, PDF and ePub downloads, according to the available data) and Abstracts Views on Vision4Press platform.
Data correspond to usage on the plateform after 2015. The current usage metrics is available 48-96 hours after online publication and is updated daily on week days.
Initial download of the metrics may take a while.