Fig. 2
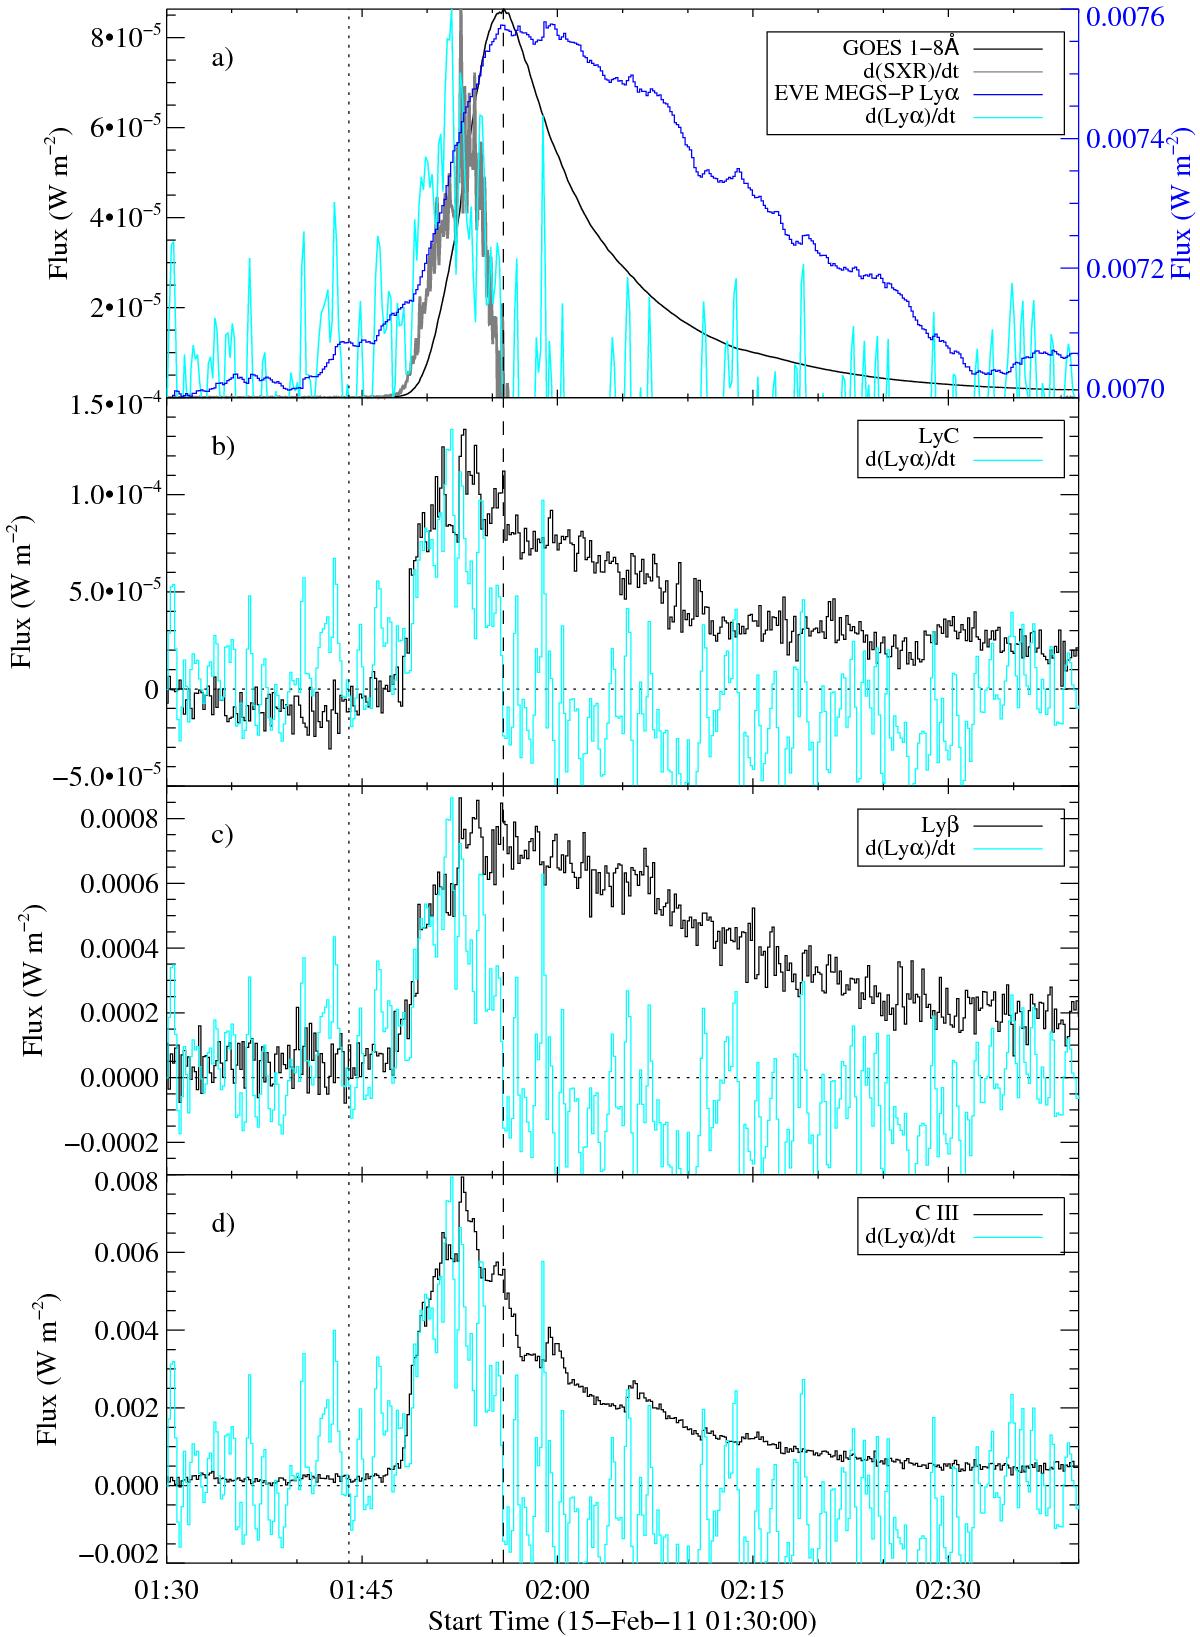
a) Lyα (blue) and SXR (black) emission and their derivatives (cyan and grey, respectively) during the 15 February 2011 flare. b) LyC lightcurve for the same event (black). Overplotted in cyan is the time derivative of the Lyα lightcurve normalized to LyC. c) Lightcurve of Lyβ (1026 Å; black curve). Overplotted in cyan is the time derivative of the Lyα lightcurve normalized to Lyβ. d) Lightcurve of C III (977 Å; black curve). Overplotted in cyan is the time derivative of the Lyα lightcurve normalized to C III. The vertical dotted and dashed lines in each panel mark the start and peak times of the GOES event, respectively.
Current usage metrics show cumulative count of Article Views (full-text article views including HTML views, PDF and ePub downloads, according to the available data) and Abstracts Views on Vision4Press platform.
Data correspond to usage on the plateform after 2015. The current usage metrics is available 48-96 hours after online publication and is updated daily on week days.
Initial download of the metrics may take a while.