Free Access
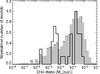
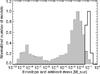
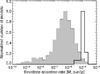
Fig. 7
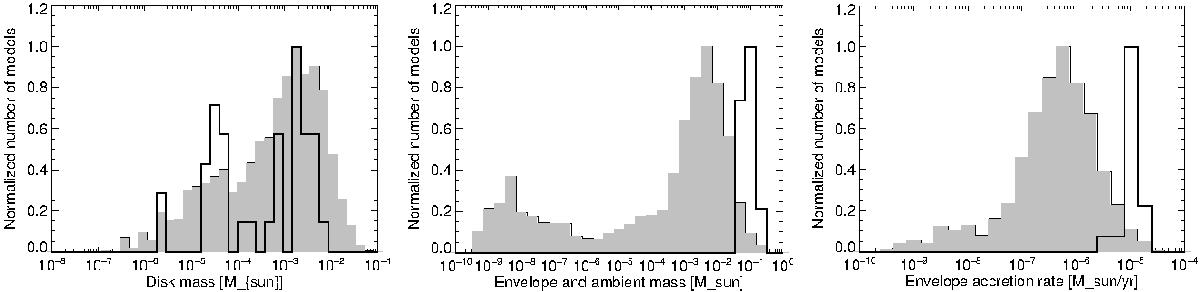
Distribution of model parameters for the 37 best-fit models (black histograms) and for the 10 000 best-fitting models (grey histograms). The distributions are normalized to their peaks. From left to right: disk mass, envelope mass, envelope accretion rate.
This figure is made of several images, please see below:
Current usage metrics show cumulative count of Article Views (full-text article views including HTML views, PDF and ePub downloads, according to the available data) and Abstracts Views on Vision4Press platform.
Data correspond to usage on the plateform after 2015. The current usage metrics is available 48-96 hours after online publication and is updated daily on week days.
Initial download of the metrics may take a while.