Fig. 6
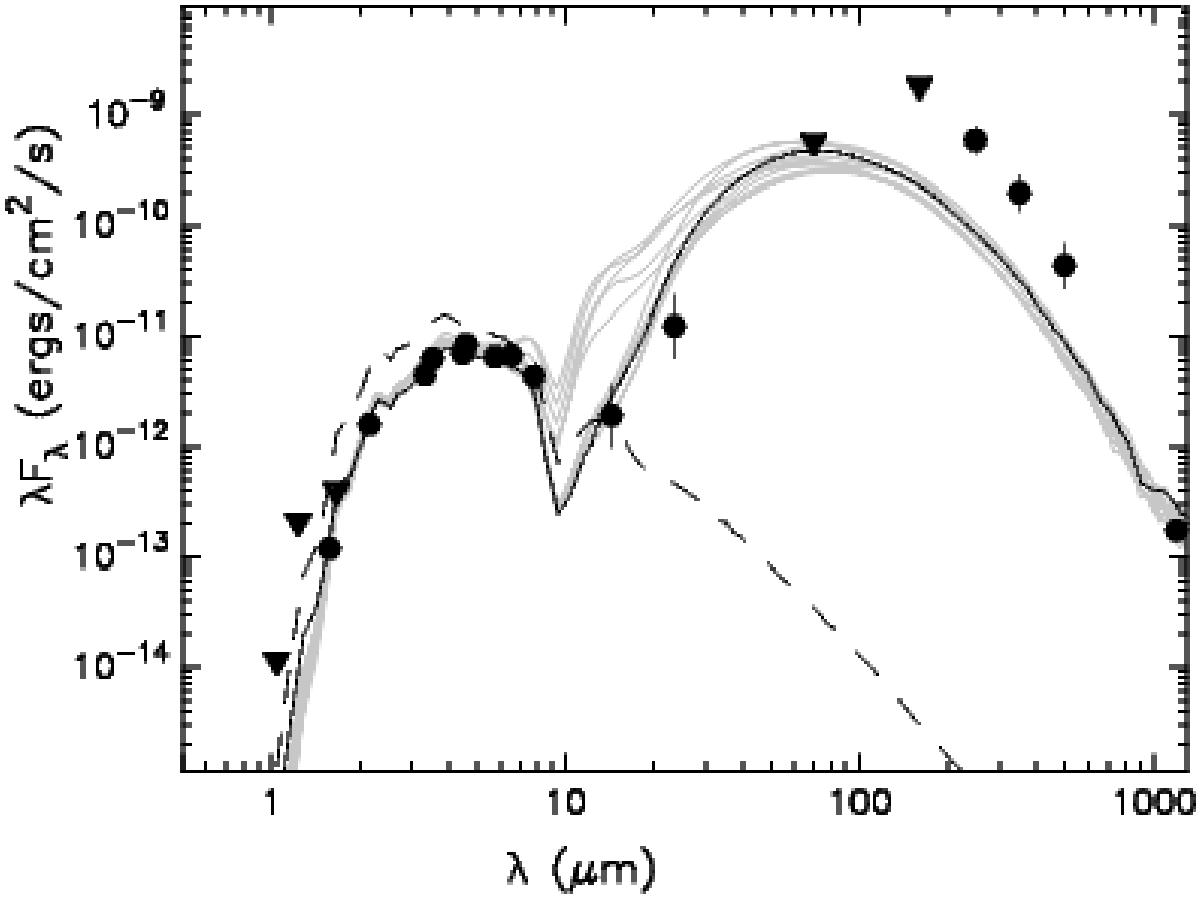
Spectral energy distribution of ISO-Oph 85 and of the 37 best model fits. Upper limits are represented as downward pointing triangles. The best-fit model is shown as solid black line and the other “statistically acceptable” models as solid grey lines. The dashed line indicates the photospheric contribution of the best-fit model.
Current usage metrics show cumulative count of Article Views (full-text article views including HTML views, PDF and ePub downloads, according to the available data) and Abstracts Views on Vision4Press platform.
Data correspond to usage on the plateform after 2015. The current usage metrics is available 48-96 hours after online publication and is updated daily on week days.
Initial download of the metrics may take a while.