Free Access
Fig. 3
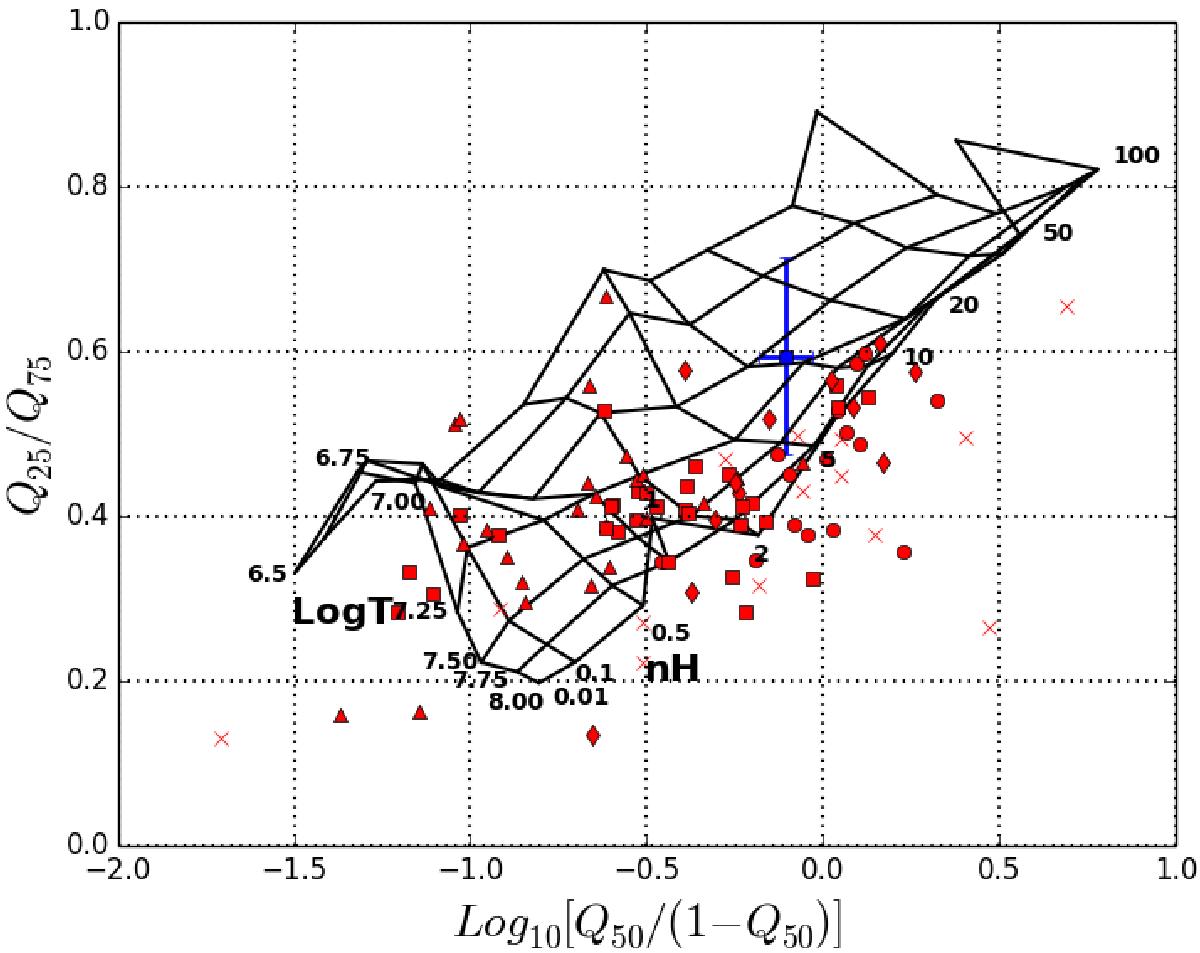
Phase space for the quantile analysis, with the parametric grid log T, NH(1022 cm-2) superimposed. The flare on ISO-Oph 85 is represented by the blue square. DROXO time-averaged sources are represented by the following symbols: Class I (circles), Flat (diamonds), Class II (squares), Class III (triangles), undefined (×).
Current usage metrics show cumulative count of Article Views (full-text article views including HTML views, PDF and ePub downloads, according to the available data) and Abstracts Views on Vision4Press platform.
Data correspond to usage on the plateform after 2015. The current usage metrics is available 48-96 hours after online publication and is updated daily on week days.
Initial download of the metrics may take a while.