Fig. 8
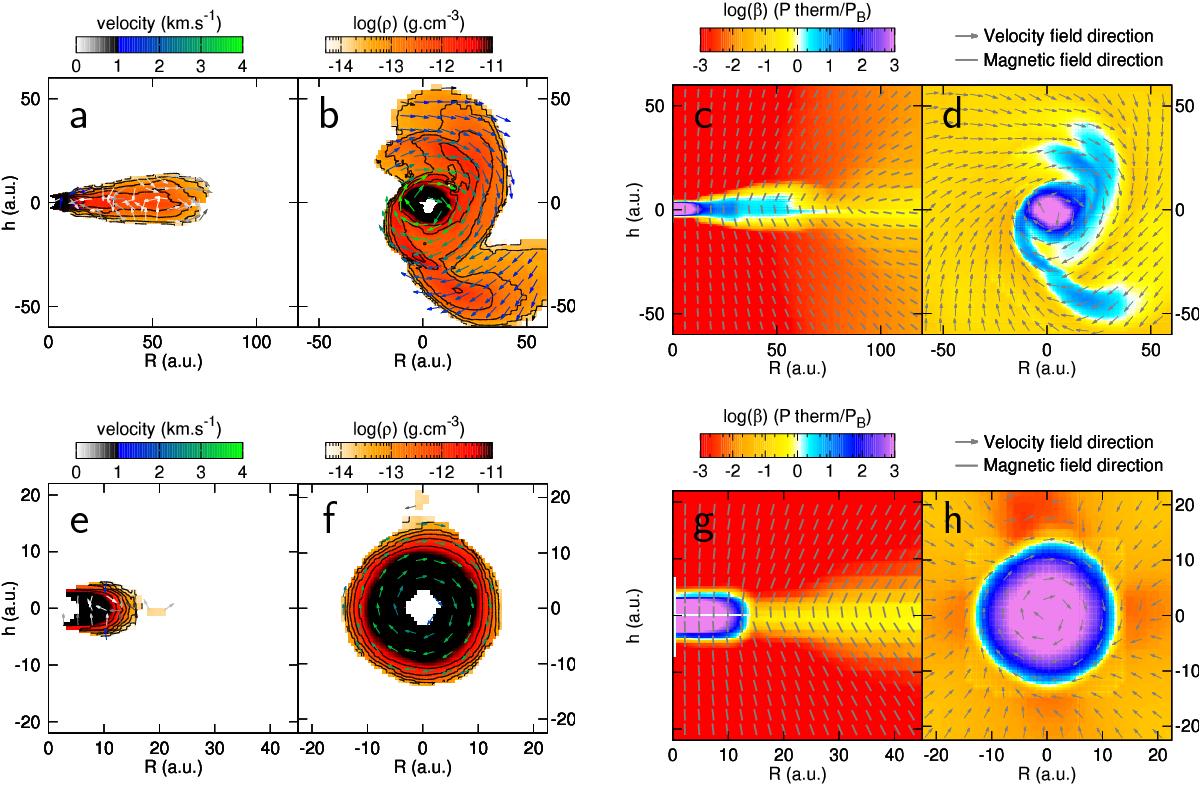
Visualisation of the disk structures. Top row: panels a) and b) show side and top views, respectively, of the disk density (orange), with the velocity vectors superimposed for μ = 5. Panels c) and d) are the same side and top views, but showing the plasma β parameter (colour map), over which we plot the magnetic field direction for the side view c) and the velocity vectors for the top view d). Bottom row: same as for the top row, but for the μ = 2 simulation. Each row has a different spatial scale.
Current usage metrics show cumulative count of Article Views (full-text article views including HTML views, PDF and ePub downloads, according to the available data) and Abstracts Views on Vision4Press platform.
Data correspond to usage on the plateform after 2015. The current usage metrics is available 48-96 hours after online publication and is updated daily on week days.
Initial download of the metrics may take a while.