Fig. 6
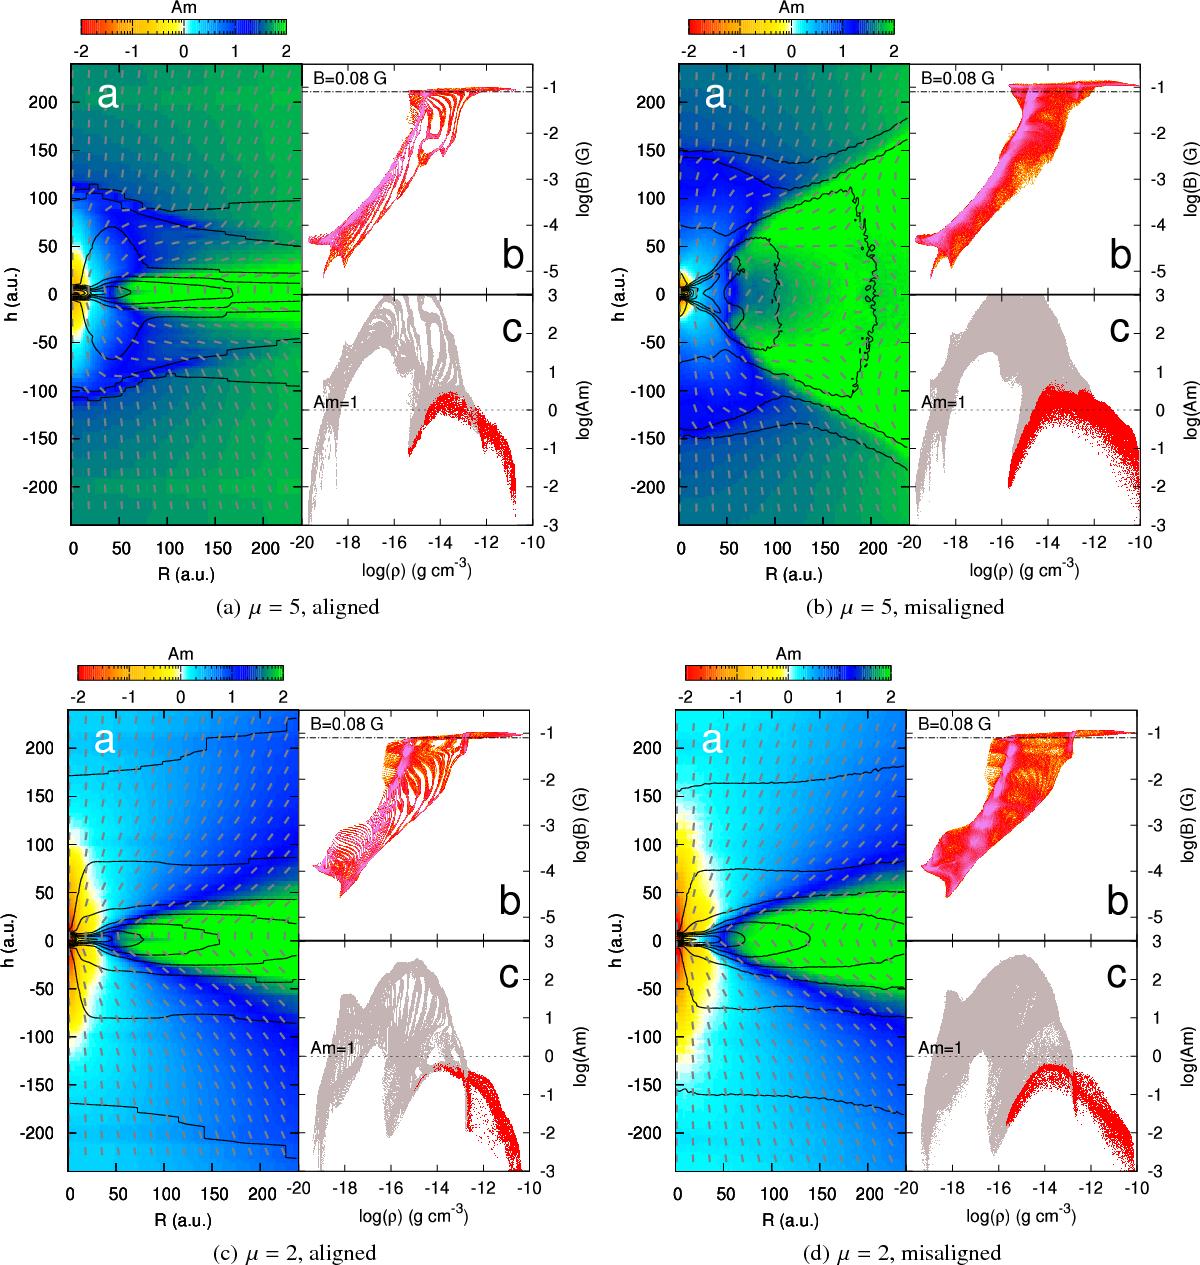
Four main panels show the ![]() aligned (top left, a),
aligned (top left, a), ![]() misaligned (top right, b),
misaligned (top right, b), ![]() aligned (bottom left, c), and
aligned (bottom left, c), and ![]() misaligned (bottom right, d) cases 500 years after first core formation. In each main panel, subpanel a) shows a colour map of the azimuthal average of
misaligned (bottom right, d) cases 500 years after first core formation. In each main panel, subpanel a) shows a colour map of the azimuthal average of ![]() . Green to blue means that dynamical processes (collapse, Keplerian disk) dominate, while red to yellow means that ambipolar diffusion dominates. The grey segments show the direction of the magnetic field, and black solid lines are isodensity contours. Panels b) and c) display the magnetic field magnitude B and the value of Am as a function of density. Red cells in the Am scatter plot are cells where B(ρ) > 0.08 G, while grey cells have B(ρ) < 0.08 G.
. Green to blue means that dynamical processes (collapse, Keplerian disk) dominate, while red to yellow means that ambipolar diffusion dominates. The grey segments show the direction of the magnetic field, and black solid lines are isodensity contours. Panels b) and c) display the magnetic field magnitude B and the value of Am as a function of density. Red cells in the Am scatter plot are cells where B(ρ) > 0.08 G, while grey cells have B(ρ) < 0.08 G.

Current usage metrics show cumulative count of Article Views (full-text article views including HTML views, PDF and ePub downloads, according to the available data) and Abstracts Views on Vision4Press platform.
Data correspond to usage on the plateform after 2015. The current usage metrics is available 48-96 hours after online publication and is updated daily on week days.
Initial download of the metrics may take a while.