Fig. 16
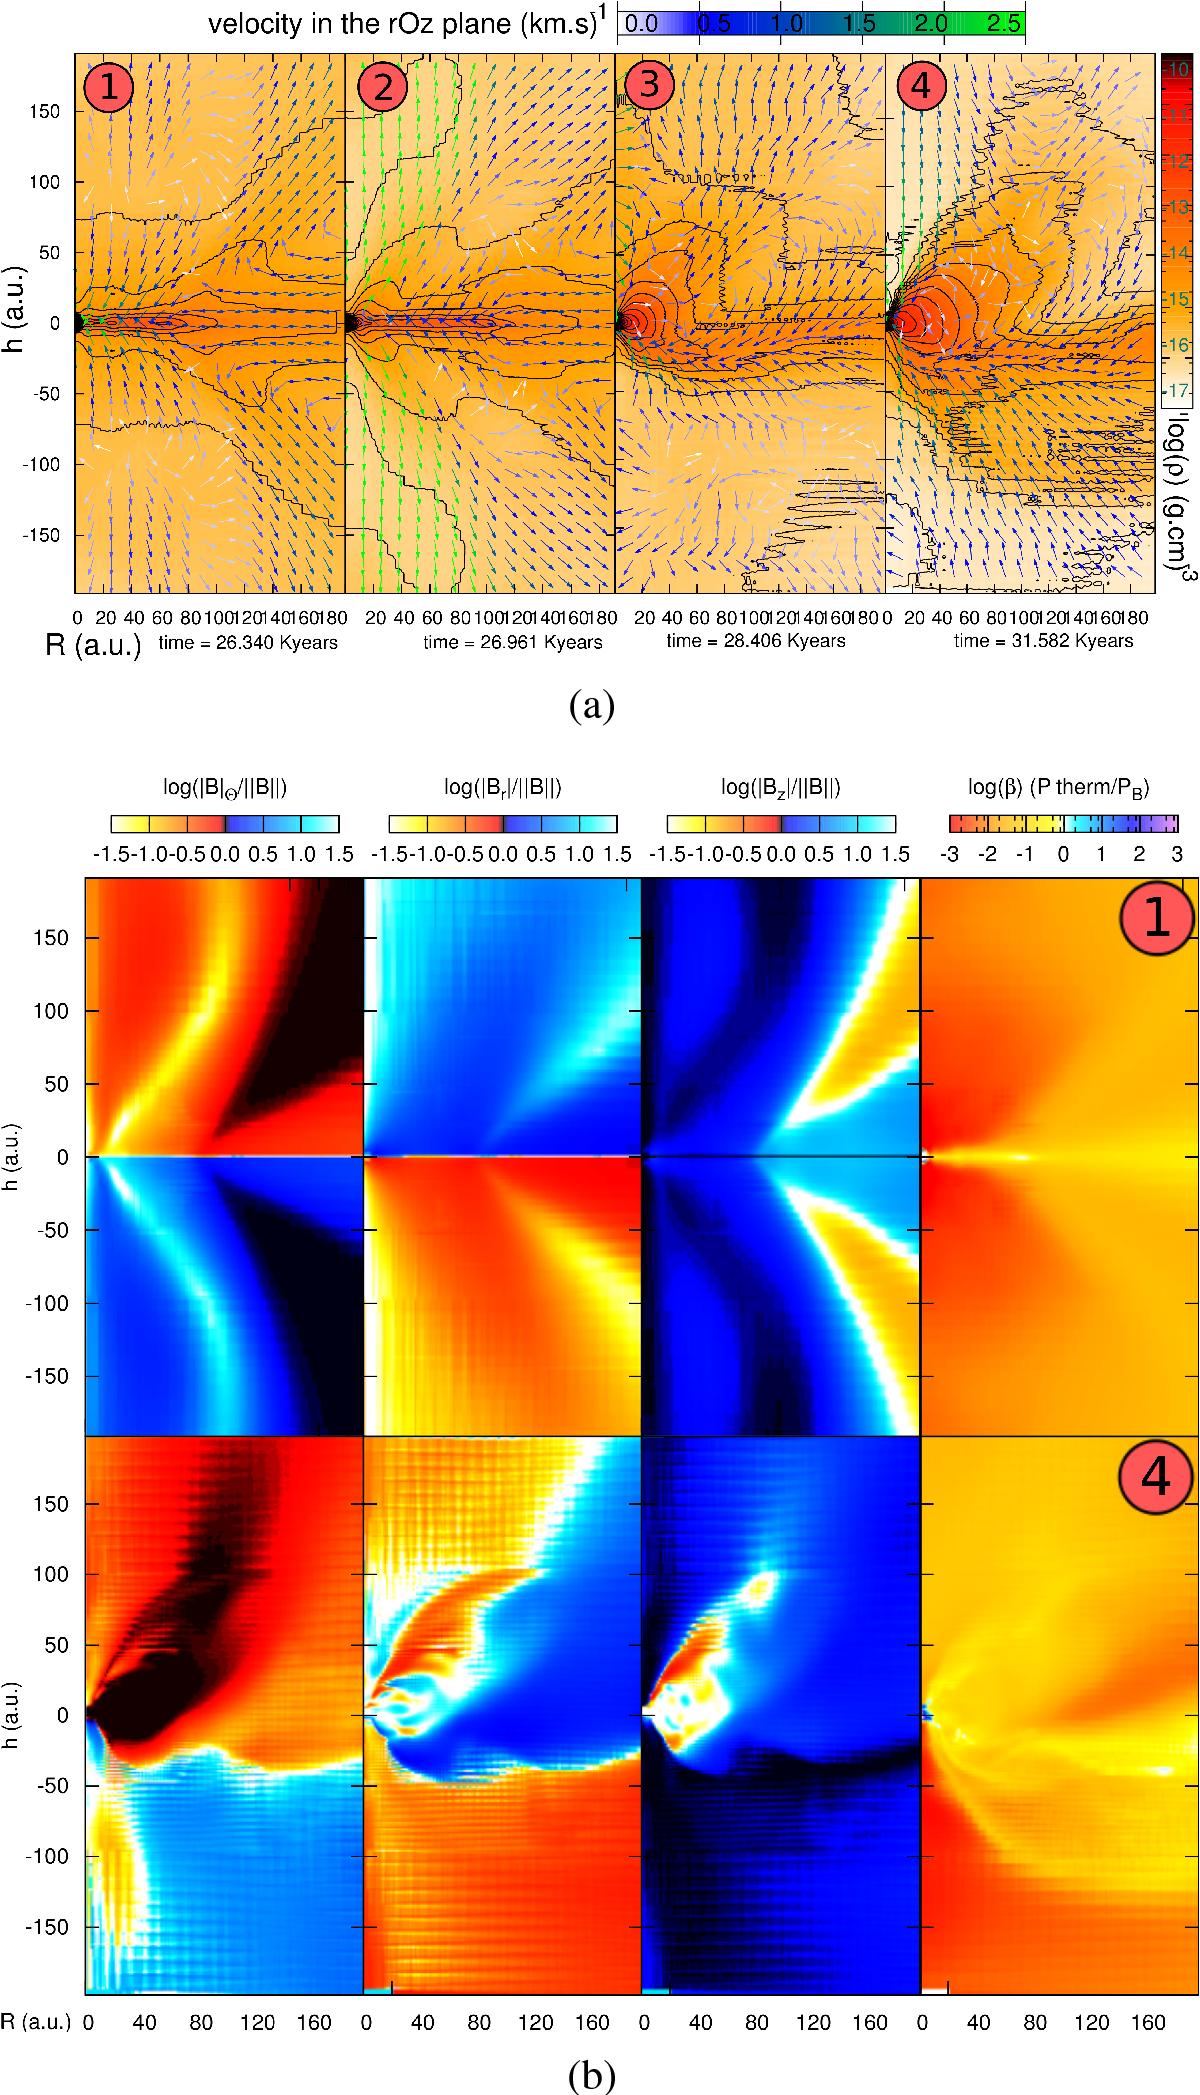
a) Evolution of the density/velocity map for the four times labelled 1−4 in Fig. 15. b) The three first columns represent the relative importance of each component of the magnetic field. The colour scale shows the value of each component as follows: black for high values (≳ 1), white for low values (≲ 10-1.5); blue and red (in-between ≳ 10-1). The rightmost column displays the plasma parameter β = P/Pmag. Snapshots for different times of interest in the iMHD μ = 5 aligned case, as labelled Fig. 15.
Current usage metrics show cumulative count of Article Views (full-text article views including HTML views, PDF and ePub downloads, according to the available data) and Abstracts Views on Vision4Press platform.
Data correspond to usage on the plateform after 2015. The current usage metrics is available 48-96 hours after online publication and is updated daily on week days.
Initial download of the metrics may take a while.