Fig. 15
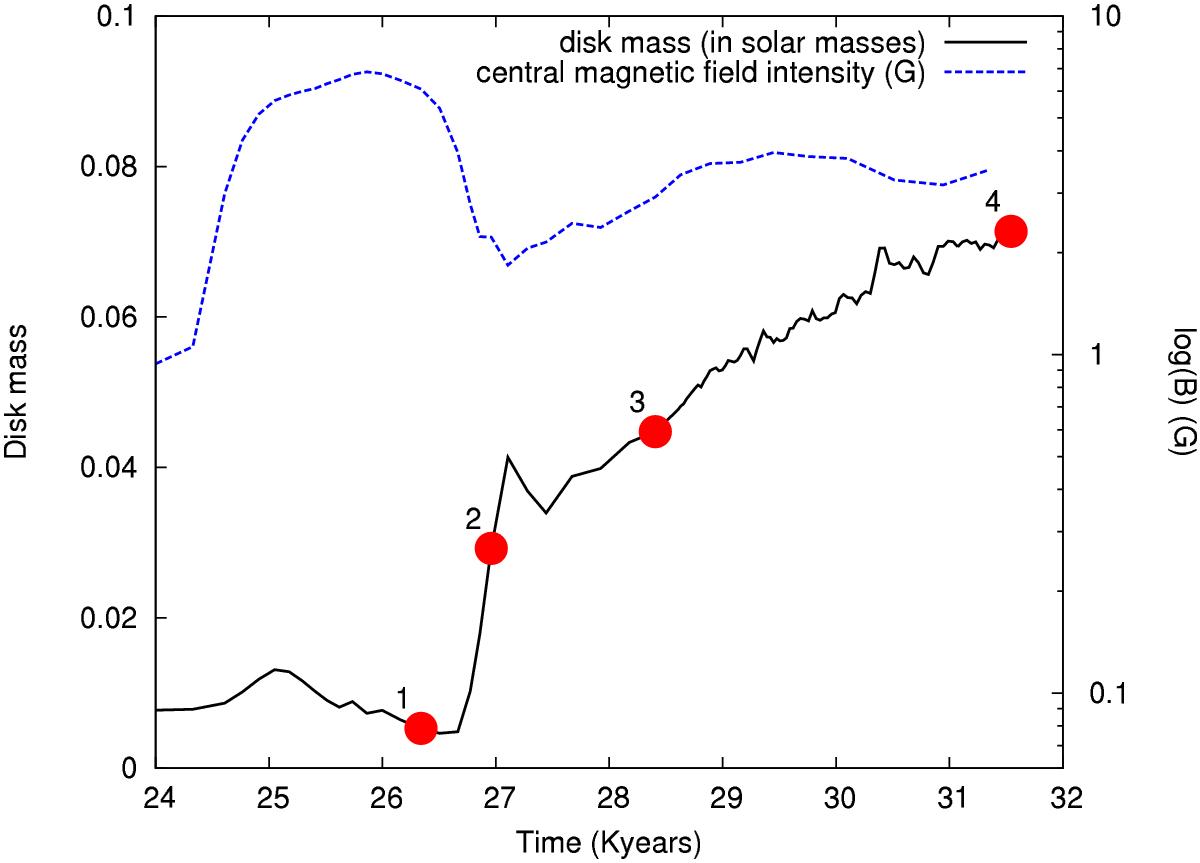
Evolution of the disk mass (solid line) and the peak magnetic field value (dashed line) for the ![]() , aligned case, in iMHD. The four red dots marked 1 to 4 indicate the times at which the snapshots in Fig. 16 were taken. We recall that the formation of the first Larson core occurs at t = 24300 years (see Table 2). The number 1 indicates the beginning of the release of magnetic flux from inside the core.
, aligned case, in iMHD. The four red dots marked 1 to 4 indicate the times at which the snapshots in Fig. 16 were taken. We recall that the formation of the first Larson core occurs at t = 24300 years (see Table 2). The number 1 indicates the beginning of the release of magnetic flux from inside the core.
Current usage metrics show cumulative count of Article Views (full-text article views including HTML views, PDF and ePub downloads, according to the available data) and Abstracts Views on Vision4Press platform.
Data correspond to usage on the plateform after 2015. The current usage metrics is available 48-96 hours after online publication and is updated daily on week days.
Initial download of the metrics may take a while.