Fig. 14
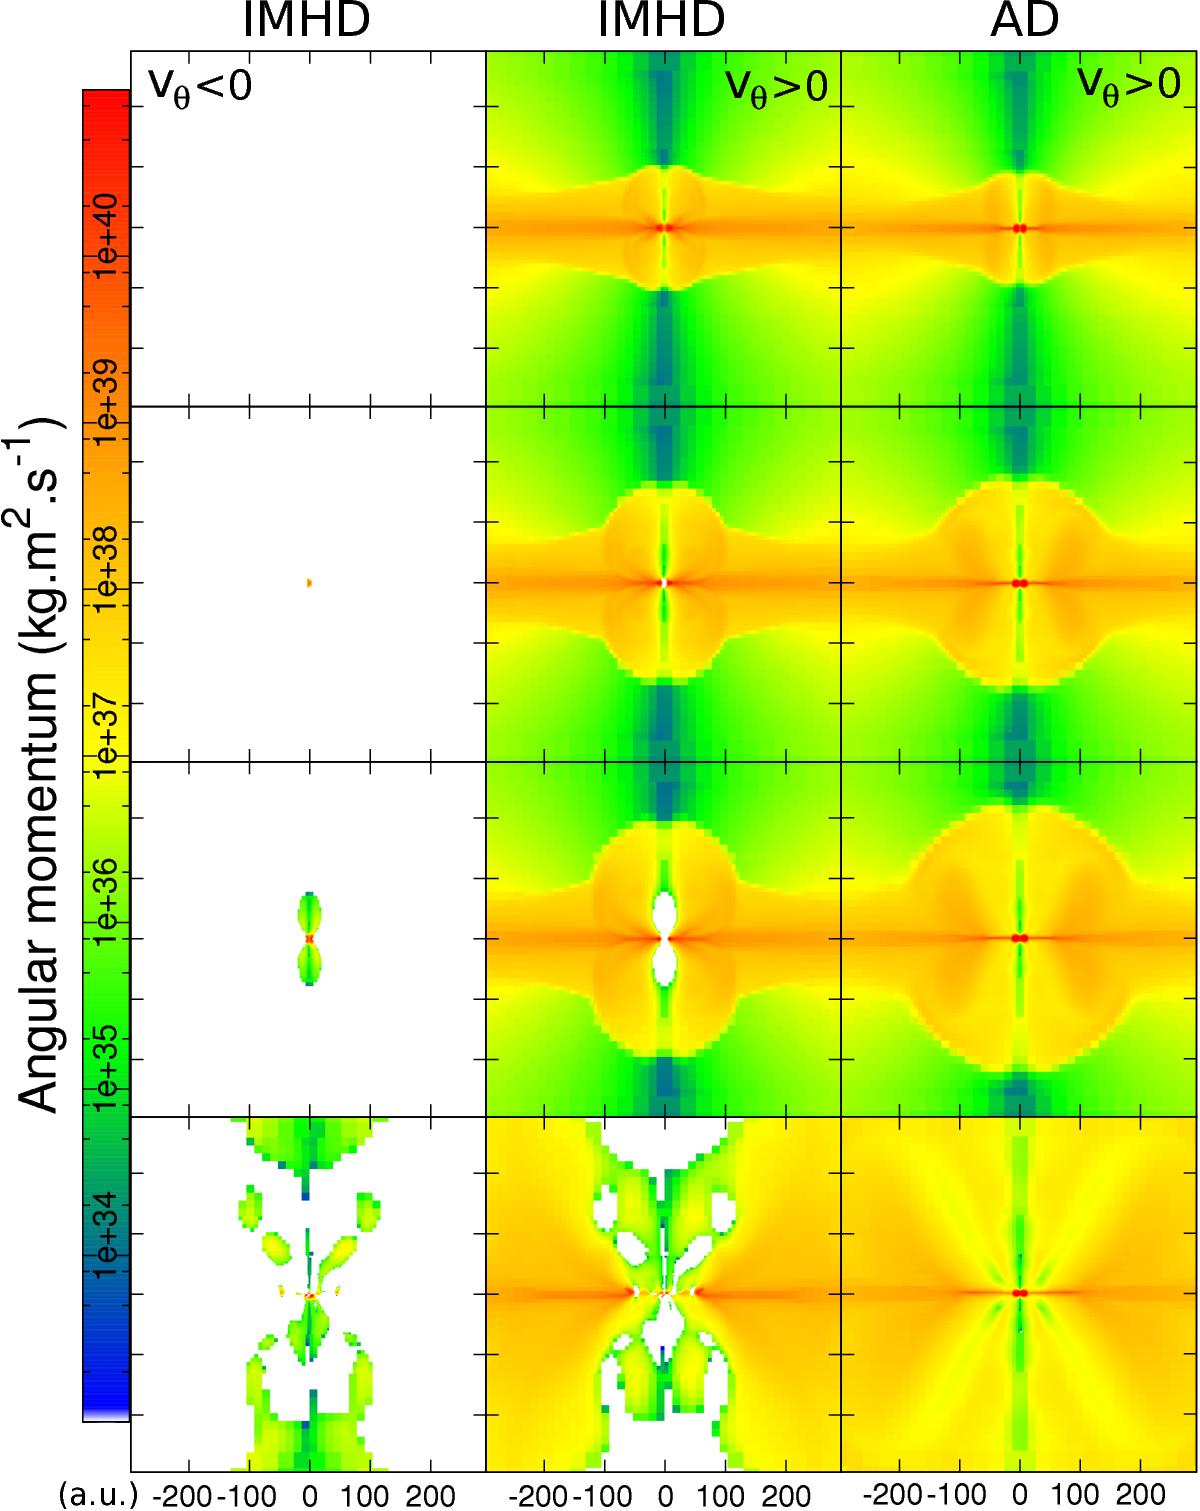
μ = 5, aligned case. Four snapshots (time increases from top to bottom) from an ideal MHD simulation (two left columns) and the ambipolar diffusion case (right column) with the magnetic field initially aligned with the rotation axis. For the iMHD simulation, the angular momentum is plotted in the left or right panel, depending on the sign of the azimuthal speed vθ in cylindrical coordinates.
Current usage metrics show cumulative count of Article Views (full-text article views including HTML views, PDF and ePub downloads, according to the available data) and Abstracts Views on Vision4Press platform.
Data correspond to usage on the plateform after 2015. The current usage metrics is available 48-96 hours after online publication and is updated daily on week days.
Initial download of the metrics may take a while.