Free Access
Fig. 10
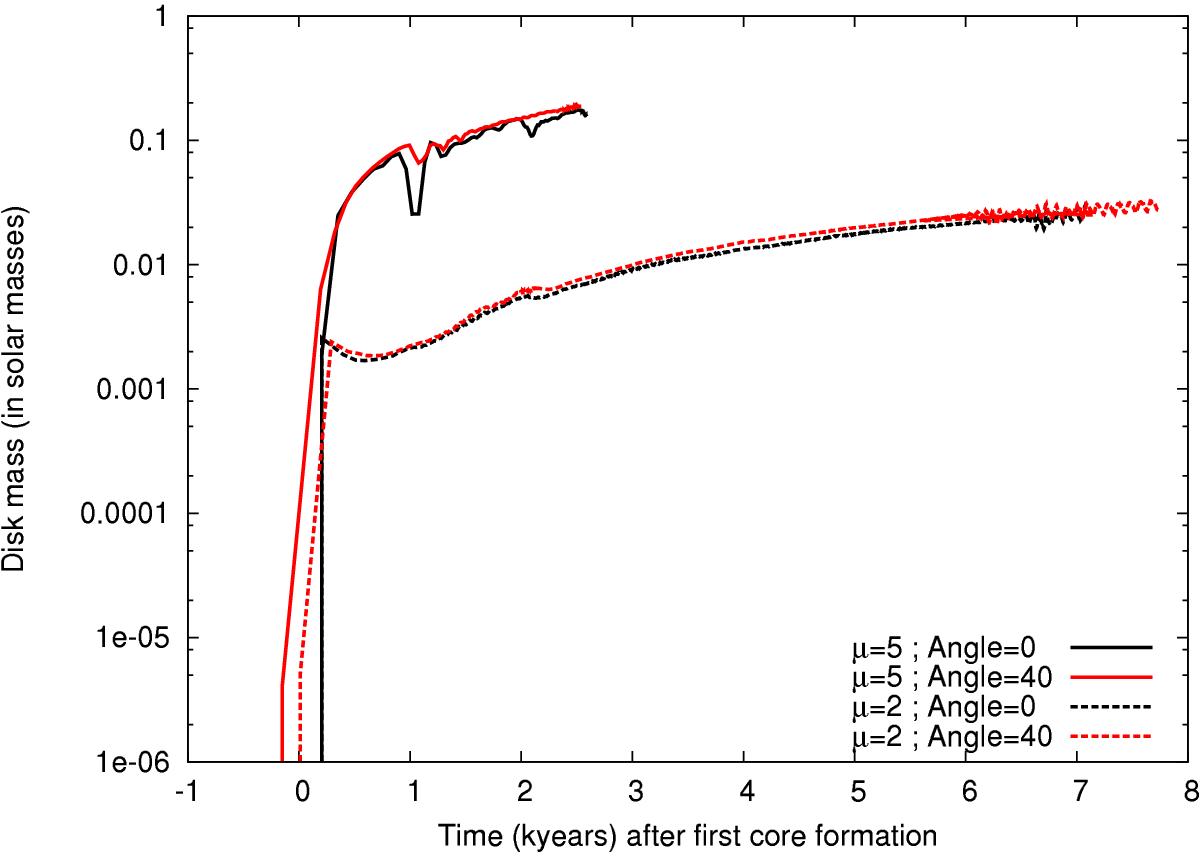
Disk mass evolution. Solid lines: μ = 5; dashed lines: μ = 2. Black: aligned case. Red: misaligned case. t = 0 corresponds to the first core formation to allow direct comparison between cases.
Current usage metrics show cumulative count of Article Views (full-text article views including HTML views, PDF and ePub downloads, according to the available data) and Abstracts Views on Vision4Press platform.
Data correspond to usage on the plateform after 2015. The current usage metrics is available 48-96 hours after online publication and is updated daily on week days.
Initial download of the metrics may take a while.