Fig. 6
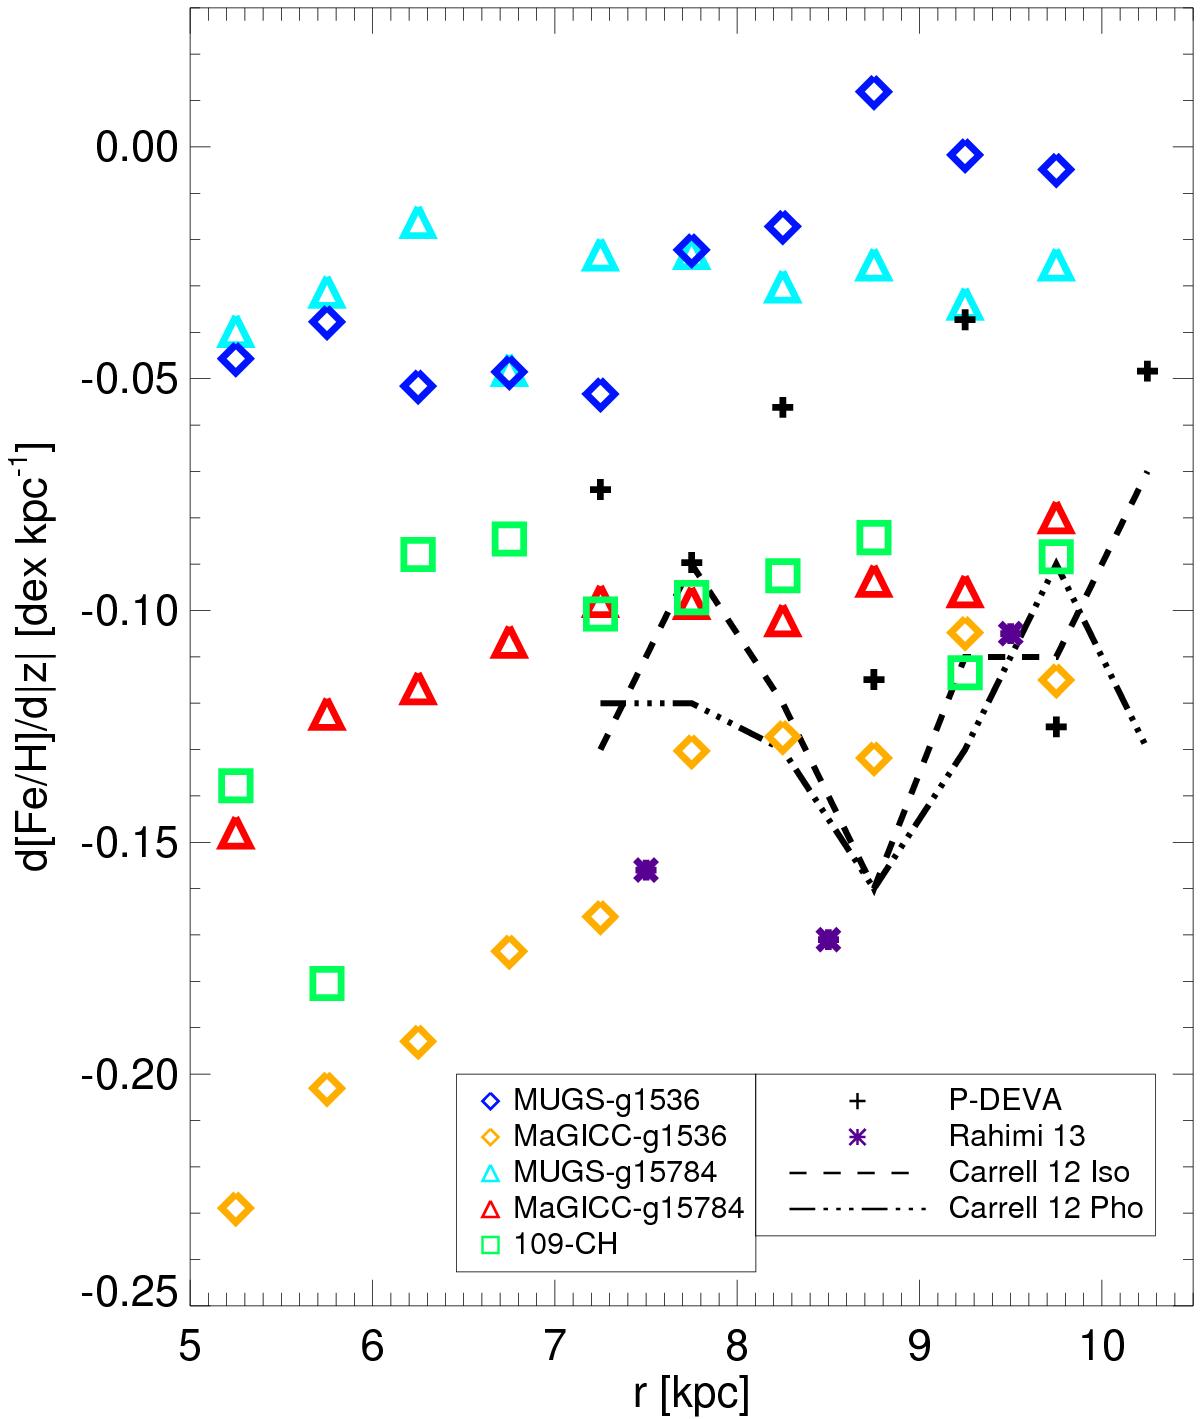
Vertical metallicity gradient as a function of radius. The figure includes data from our five simulations: two MUGS galaxies, the same two galaxies but with MaGICC feedback conditions and 109-CH. Observational data from Carrell et al. (2012) is shown with lines and results from the simulation in Rahimi et al. (2014) with purple asterisks. P-DEVA galaxy is indicated with black plus signs. All results are based upon stars selected from the vertical range 1 < | z | < 3 kpc.
Current usage metrics show cumulative count of Article Views (full-text article views including HTML views, PDF and ePub downloads, according to the available data) and Abstracts Views on Vision4Press platform.
Data correspond to usage on the plateform after 2015. The current usage metrics is available 48-96 hours after online publication and is updated daily on week days.
Initial download of the metrics may take a while.