Fig. 5
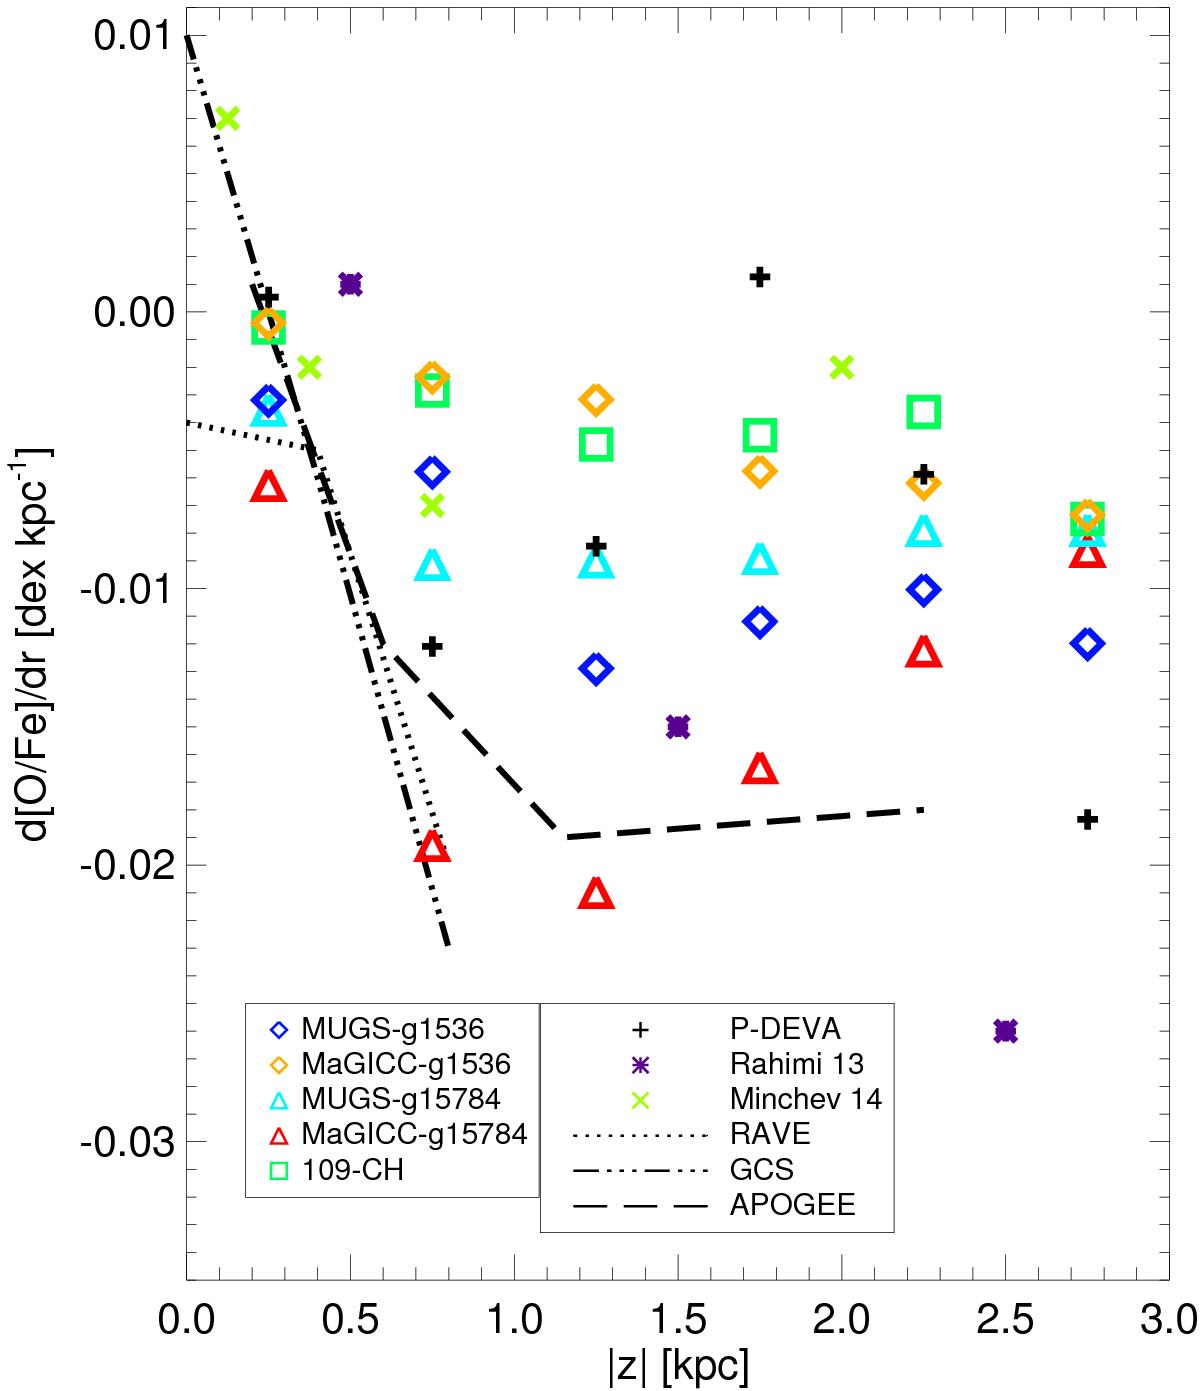
[O/Fe] radial gradient as a function of distance from the galactic plane |z|. The disc stars with 5 <r< 10 kpc of our five simulations are plotted: MUGS-g1536 in blue diamonds, MaGICC-g1536 in orange diamonds, MUGS-g15784 in cyan triangles, MaGICC-g15784 in red triangles and 109-CH in green squares. Results from some external simulations are also shown (P-DEVA in black plus signs, Rahimi et al. 2014 in purple asterisks and Minchev et al. 2014 in light green crosses), alongside the observational data from Boeche et al. (2013) (RAVE: dotted line; GCS survey: triple dot dashed line) and Anders et al. (2014; APOGEE: dashed line).
Current usage metrics show cumulative count of Article Views (full-text article views including HTML views, PDF and ePub downloads, according to the available data) and Abstracts Views on Vision4Press platform.
Data correspond to usage on the plateform after 2015. The current usage metrics is available 48-96 hours after online publication and is updated daily on week days.
Initial download of the metrics may take a while.