Fig. A.6
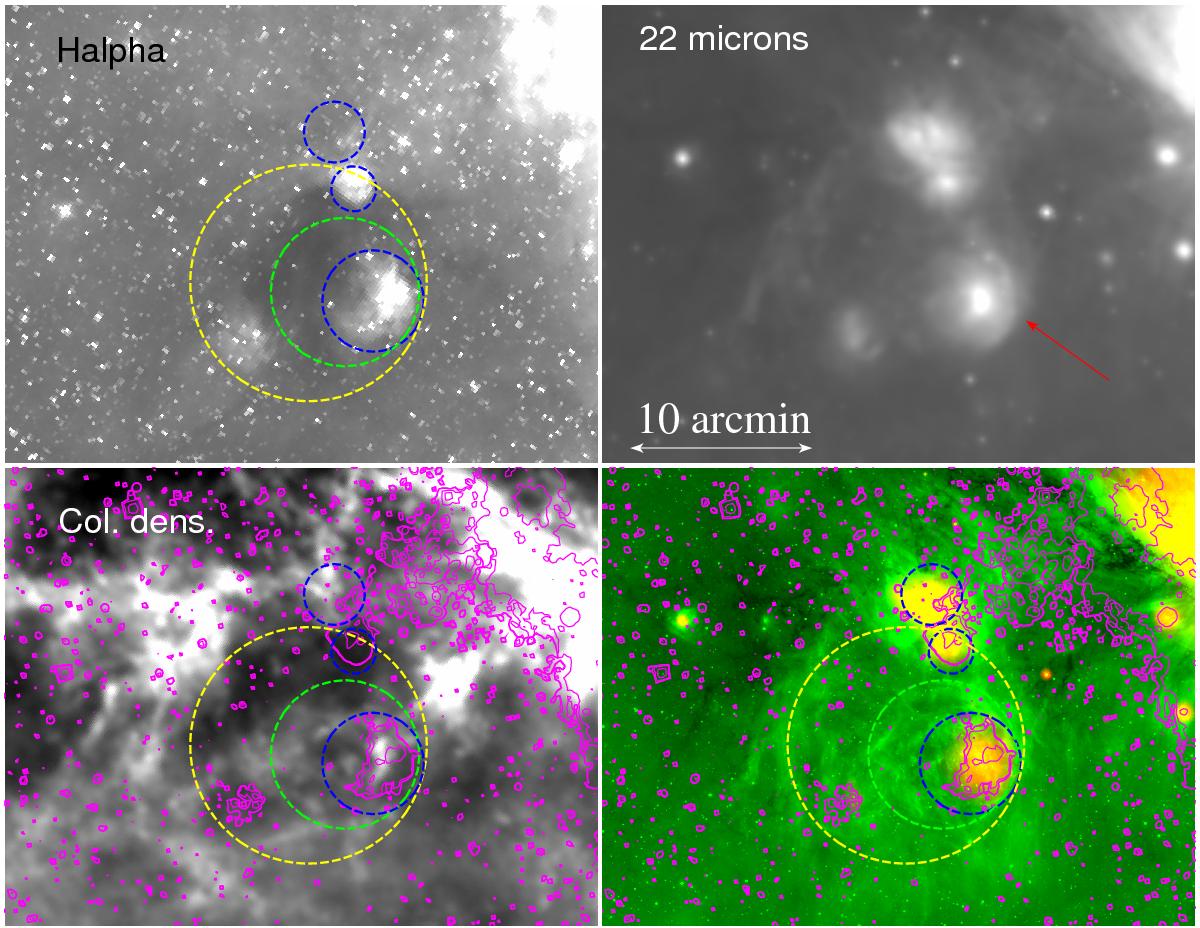
Multiwavelength view (galactic coordinates orientation) of the group of H ii regions (G351.65+0.51, G351.69+0.67, G351.68+0.61, and G351.766+0.492). Blue dashed circles indicate the radio sources while the green and yellow circles underline the 8 μm bubbles. The lower-right image combines Spitzer-8 μm (green) and WISE-22 μm (red) images. The magenta isocontours underline the Hα emission. Similar to Gvaramadze et al. (2011), the bow-shock aspect of G351.65+0.51 can be seen on the WISE-22 μm image (red arrow in the upper-right panel).
Current usage metrics show cumulative count of Article Views (full-text article views including HTML views, PDF and ePub downloads, according to the available data) and Abstracts Views on Vision4Press platform.
Data correspond to usage on the plateform after 2015. The current usage metrics is available 48-96 hours after online publication and is updated daily on week days.
Initial download of the metrics may take a while.