Fig. A.4
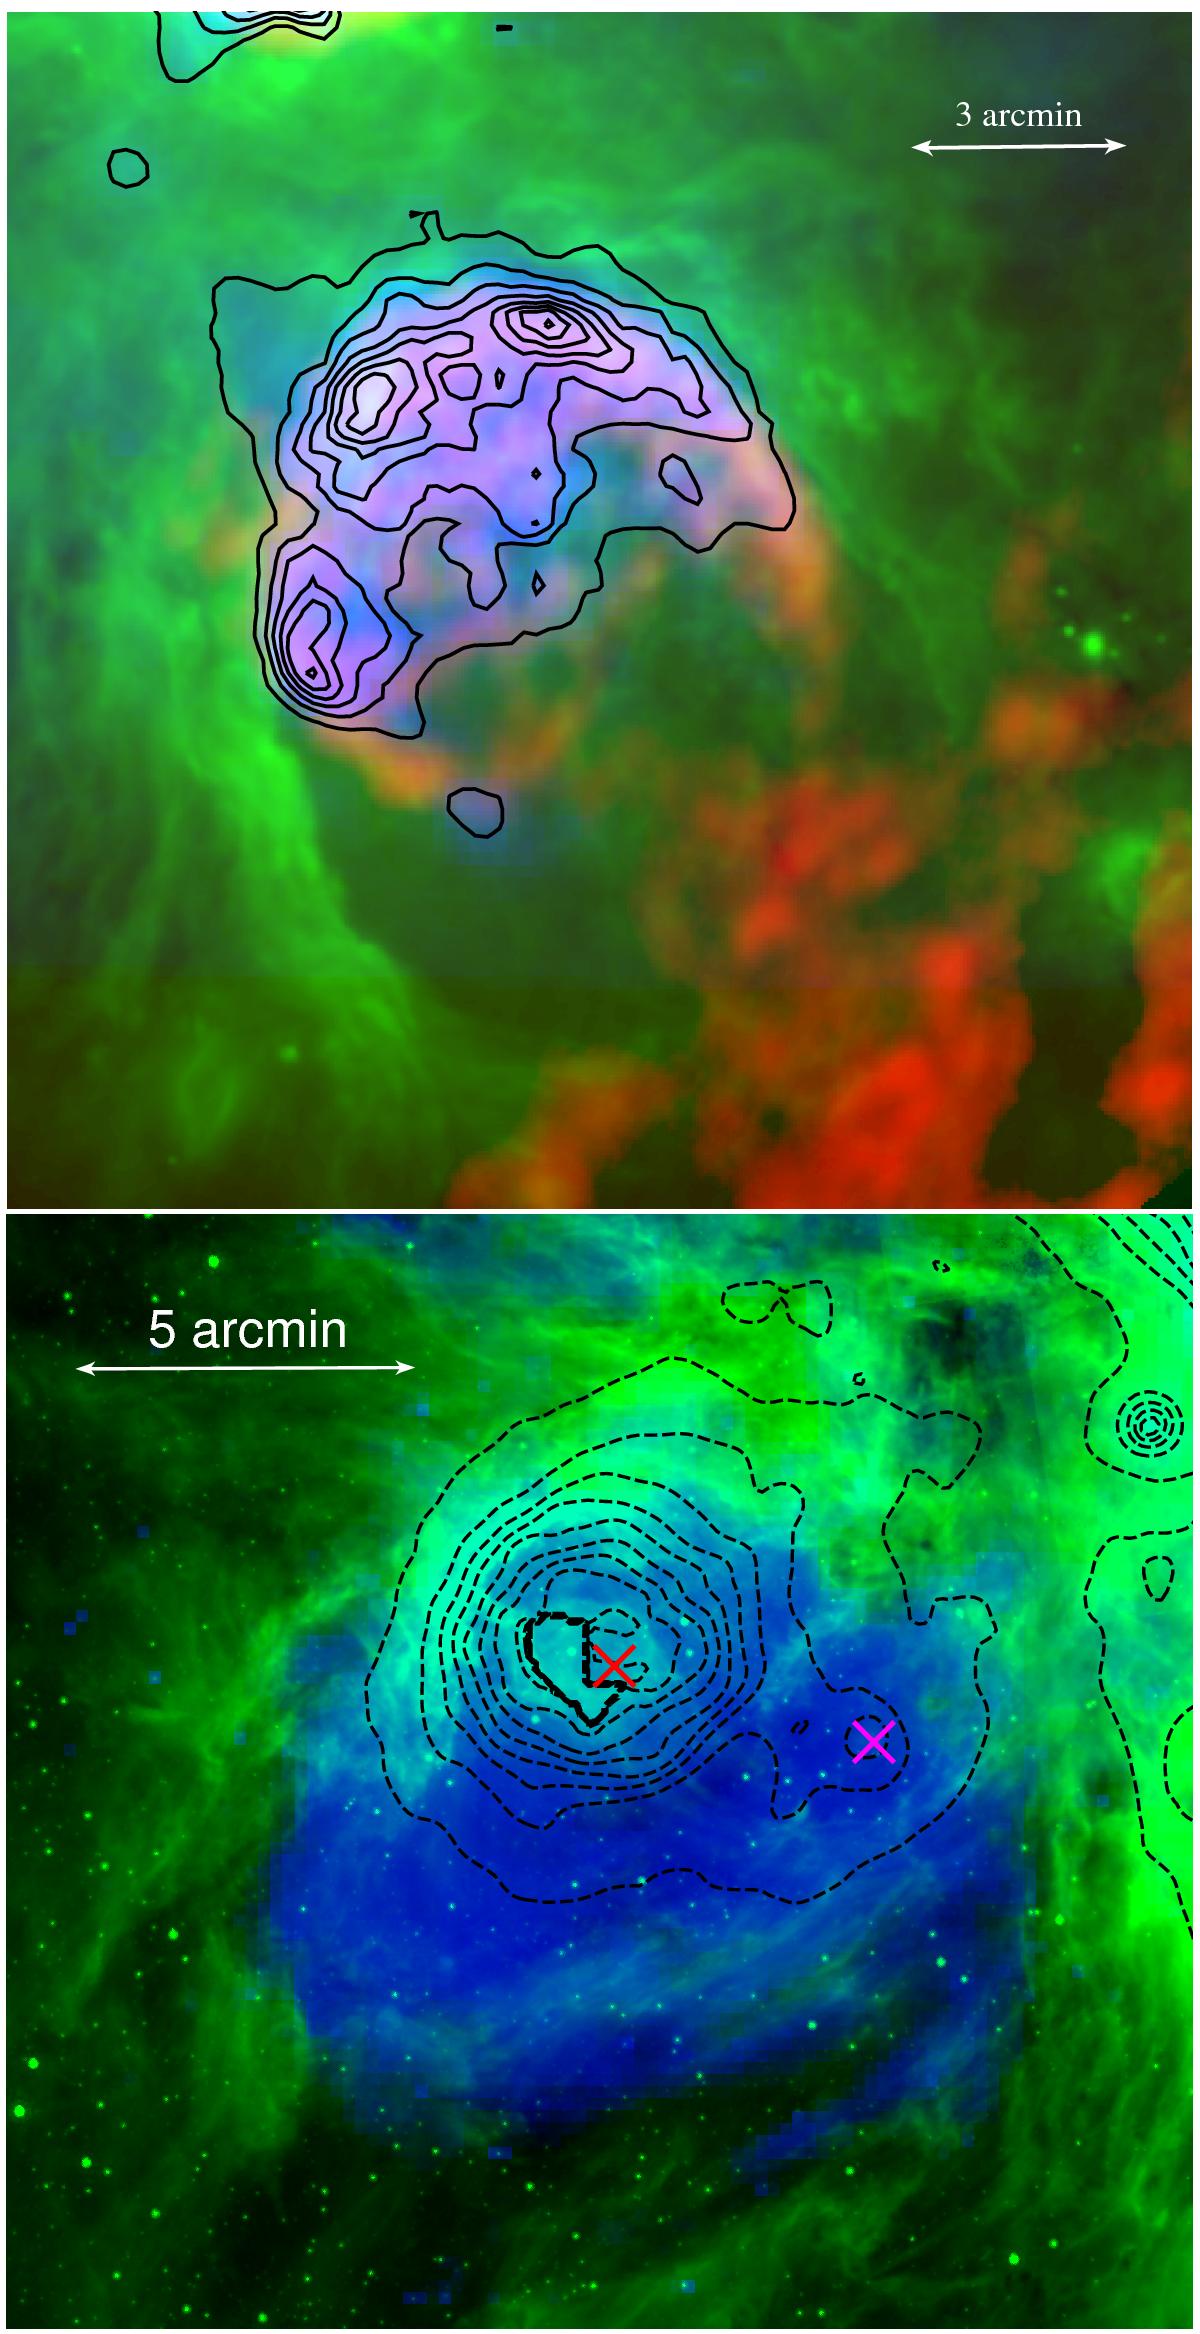
Composite image (North up, East left) of GUM 61 (upper panel) and H ii351.2+0.5 (lower panel). In the upper panel, the RGB colors are: ATCA continuum 1.6 GHz (Munõz et al. 2007), Hershel − 70 μm (Russeil et al. 2013), and UKST Hα (Parker et al. 2005), enhanced with isocontours. In the lower panel the colours are: Spitzer − 8 μm in green and UKST Hα (Parker et al. 2005) in blue. The isocontours trace the WISE-22 μm emission (the final isocontour underlines the saturated area). The red and magenta crosses indicate the stars HD156738 and ALS 4095, respectively (see text).
Current usage metrics show cumulative count of Article Views (full-text article views including HTML views, PDF and ePub downloads, according to the available data) and Abstracts Views on Vision4Press platform.
Data correspond to usage on the plateform after 2015. The current usage metrics is available 48-96 hours after online publication and is updated daily on week days.
Initial download of the metrics may take a while.