Fig. 14
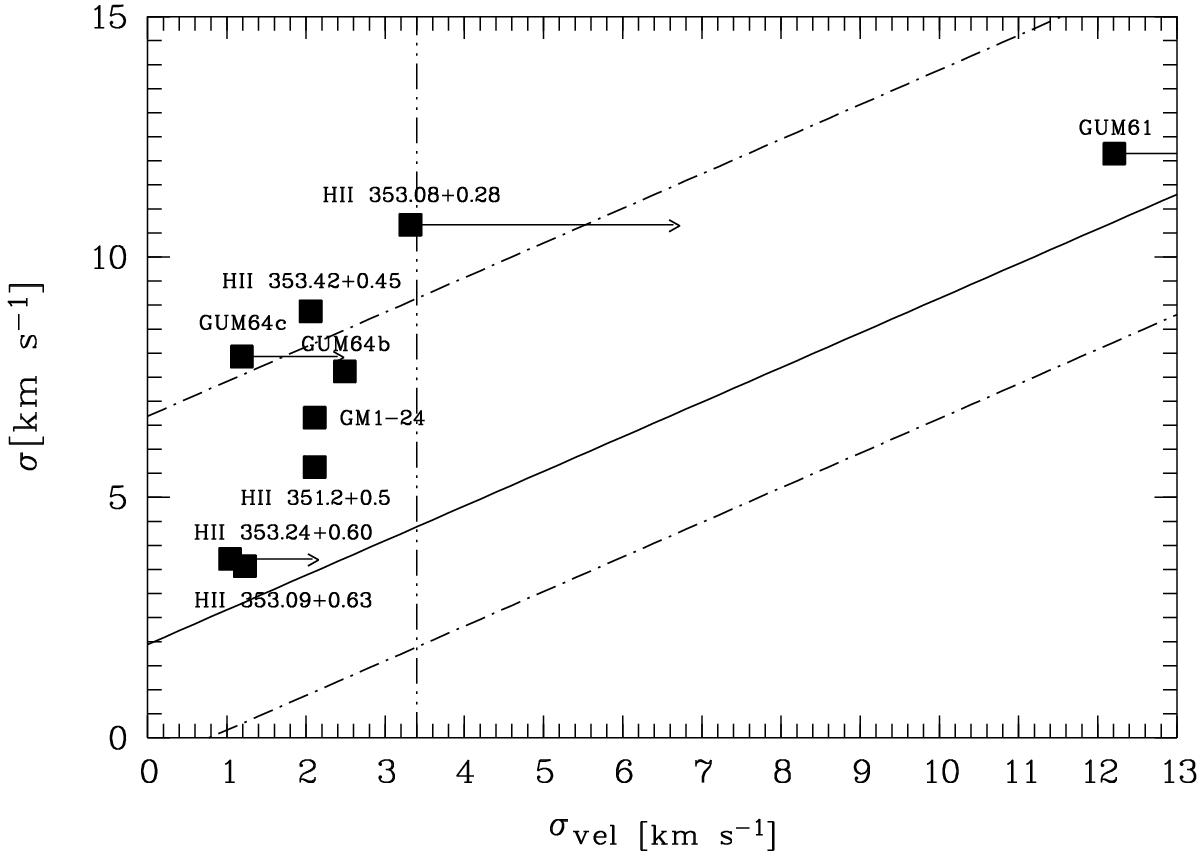
The σvel versus σ diagram. The solid line indicates the linear regression (the dashed line highlight the extremes of the distribution) througth the distribution of simulated H ii regions for different inclination angles from Lagrois et al. (2011) and Arthur & Hoare (2006). The vertical dash-dotted line indicates the separation between H ii regions in champagne phase perturbed (on the right) or not (on the left) by an expanding wind bubble. The squares show the optical H ii regions listed in Table 1. The arrows indicate the possible shift resulting from the extinction effect.
Current usage metrics show cumulative count of Article Views (full-text article views including HTML views, PDF and ePub downloads, according to the available data) and Abstracts Views on Vision4Press platform.
Data correspond to usage on the plateform after 2015. The current usage metrics is available 48-96 hours after online publication and is updated daily on week days.
Initial download of the metrics may take a while.