Fig. 10
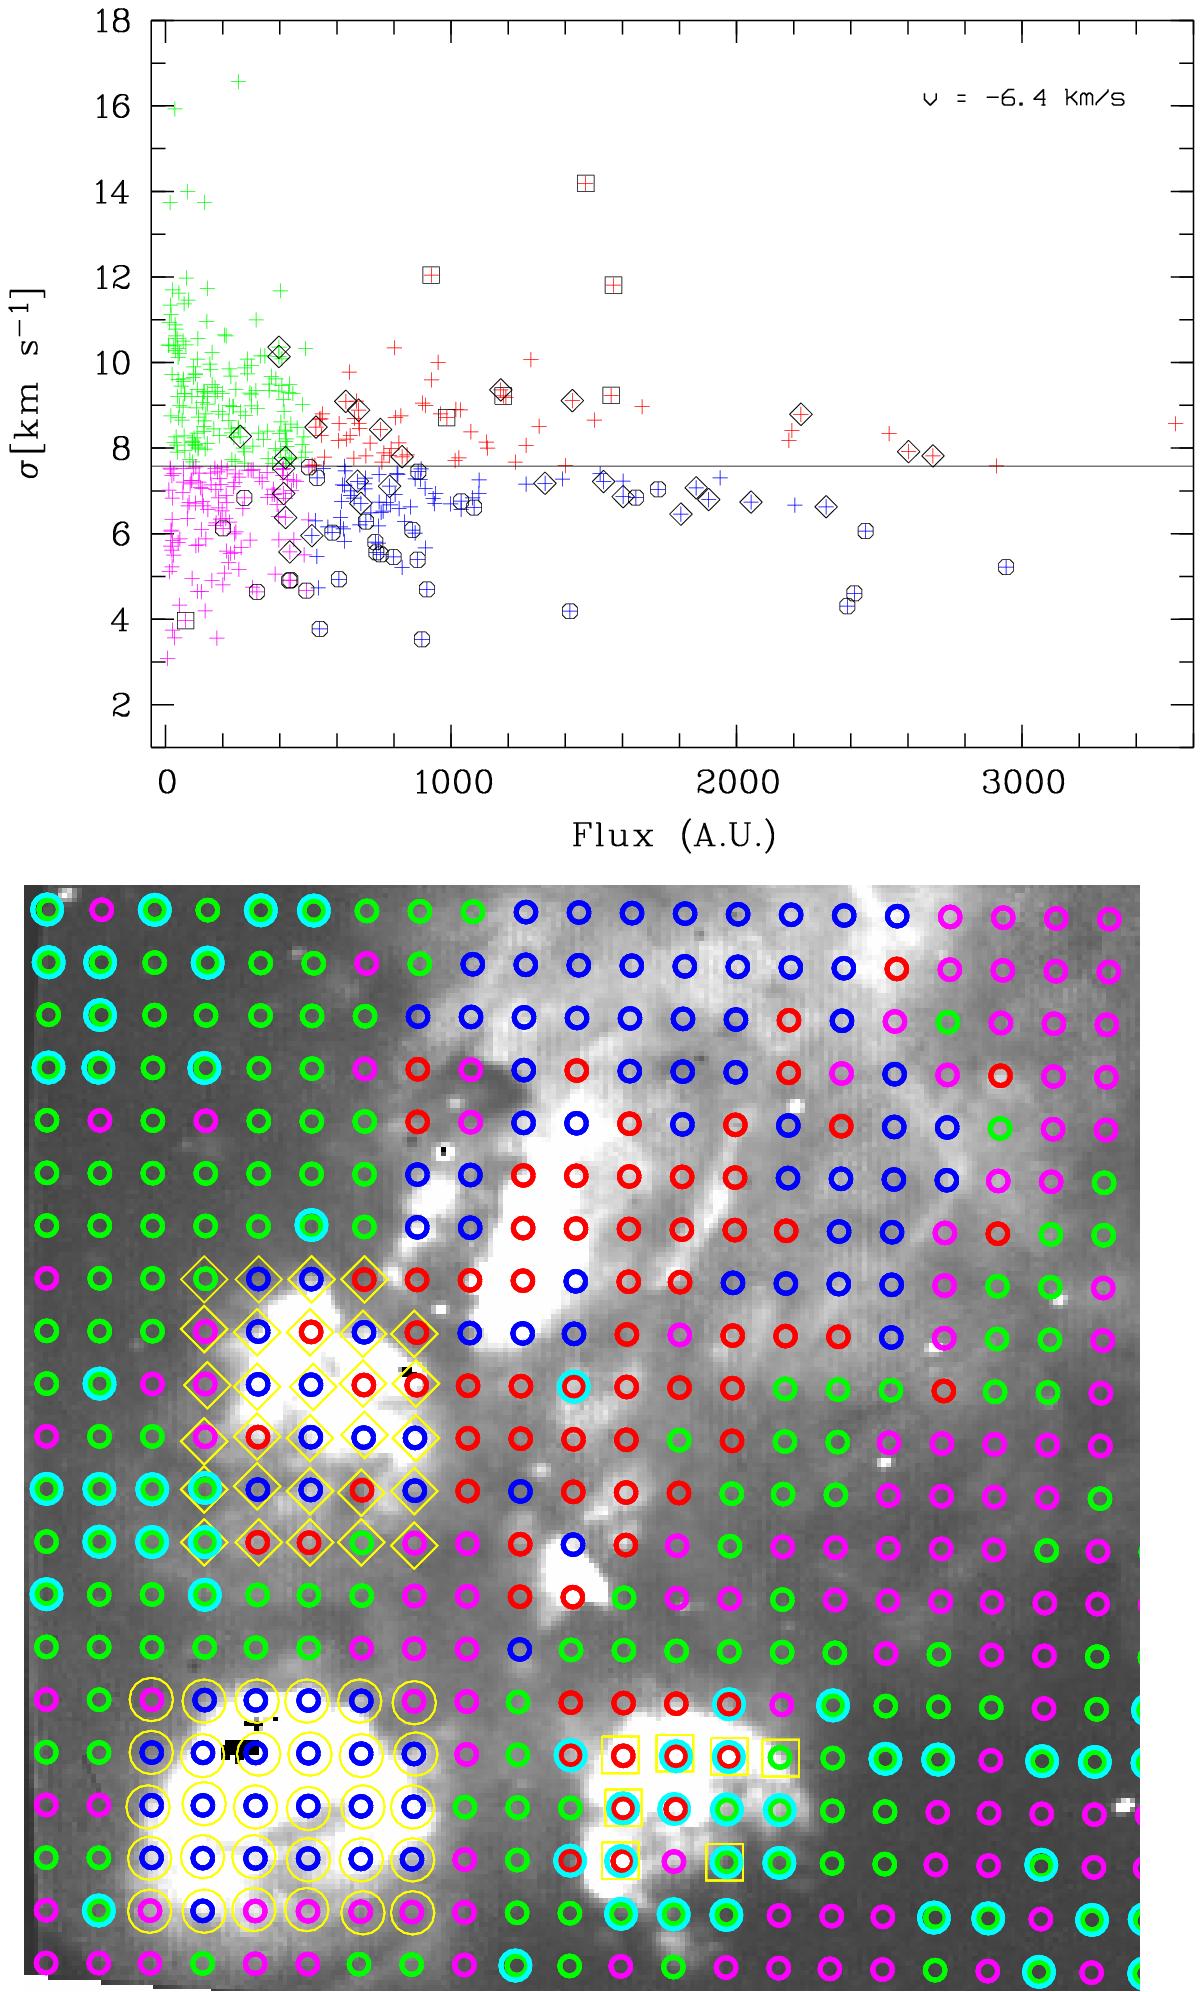
Top: NGC 6334 central area σ versus flux diagram. Fluxes are in arbitrary units. The horizontal line is σm (see text). Bottom: the location of the zones identified by different colors on the σ− flux plot overlaid on the image. North is up and East is to the right. In this field 12% of the profiles show σ> 10 km s-1. The positions where σ> 10 km s-1 are underlined in cyan. In both panels, the points overlaid with square, lozenge and circle symbols belong to GUM 61, GUM 64b, and H ii 351.2+0.5 respectively.
Current usage metrics show cumulative count of Article Views (full-text article views including HTML views, PDF and ePub downloads, according to the available data) and Abstracts Views on Vision4Press platform.
Data correspond to usage on the plateform after 2015. The current usage metrics is available 48-96 hours after online publication and is updated daily on week days.
Initial download of the metrics may take a while.