Fig. 3
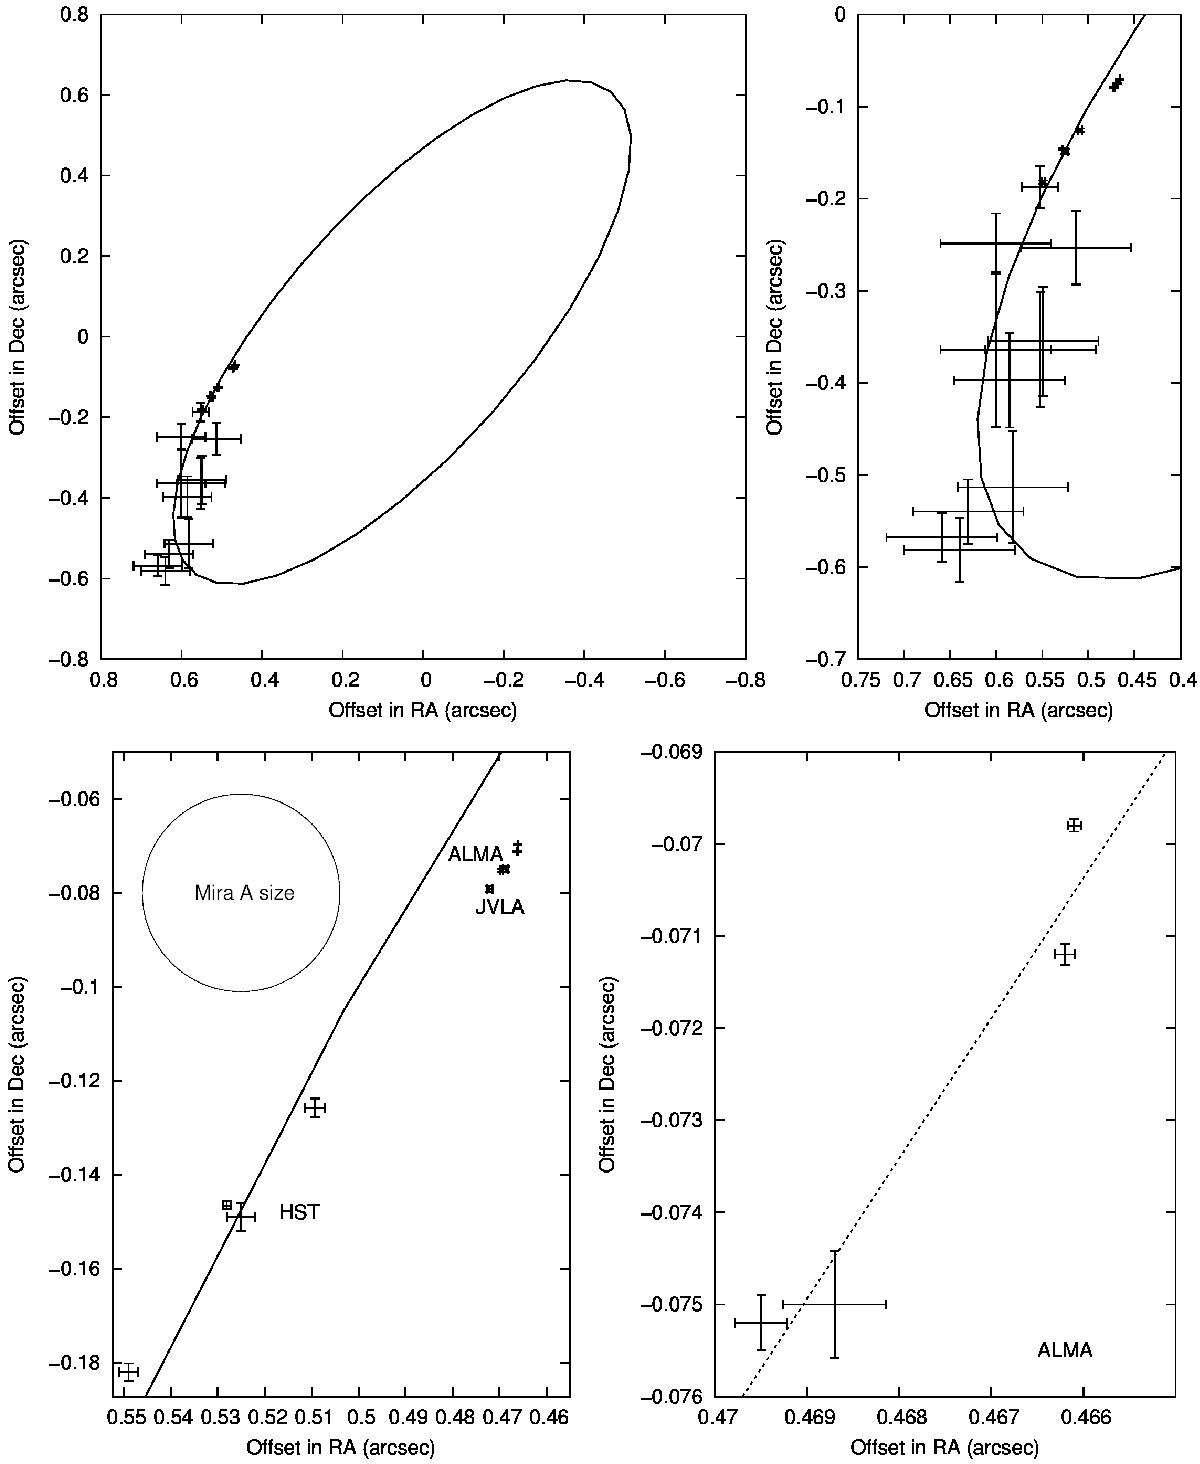
Relative position of the binary. In the top panels, the preliminary orbit determined by Prieur et al. (2002) is overlaid on the results of optical observations done since 1923, binned in five-year intervals. The 1σ dispersion of the values in each bin is shown with error bars. The HST and ALMA results of our analysis are included too, and they are more clearly shown in the bottom left panel together with HST and JVLA results by other authors (cf. Table 2). The deviation from the preliminary orbit is distinctly seen. The circle shows the size of Mira A at 229 GHz. The bottom right panel shows the ALMA measurements and their formal uncertainty. The dotted line is the result of an unweighted linear fit used to estimate the accuracy of the ALMA derived positions; the rms of the residuals is 0.̋0008.
Current usage metrics show cumulative count of Article Views (full-text article views including HTML views, PDF and ePub downloads, according to the available data) and Abstracts Views on Vision4Press platform.
Data correspond to usage on the plateform after 2015. The current usage metrics is available 48-96 hours after online publication and is updated daily on week days.
Initial download of the metrics may take a while.