Fig. 2
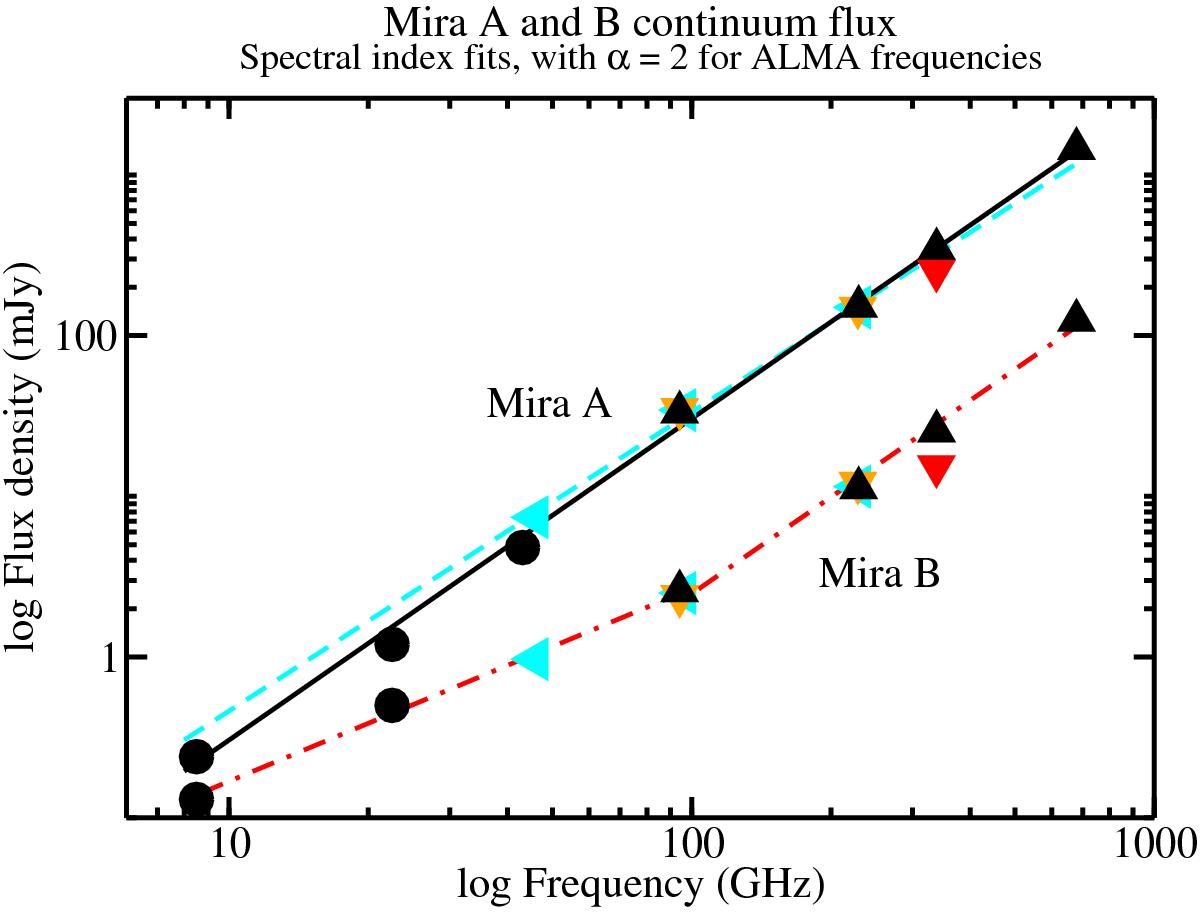
Measured values of the Mira A and Mira B continuum flux. Black upward facing triangles correspond to the ALMA measurements presented here. Orange downward facing triangles correspond to the results obtained from ALMA data by Vlemmings et al. (2015), and red downward facing triangles to those from Ramstedt et al. (2014). Cyan leftward facing triangles correspond to the results obtained from ALMA and JVLA data by Matthews et al. (2015). Black circles correspond to VLA results extracted from the papers by Matthews & Karovska (2006) and Reid & Menten (2007). The straight lines correspond to fits to all or to a fraction of the data obtained toward each star.
Current usage metrics show cumulative count of Article Views (full-text article views including HTML views, PDF and ePub downloads, according to the available data) and Abstracts Views on Vision4Press platform.
Data correspond to usage on the plateform after 2015. The current usage metrics is available 48-96 hours after online publication and is updated daily on week days.
Initial download of the metrics may take a while.