Fig. 7
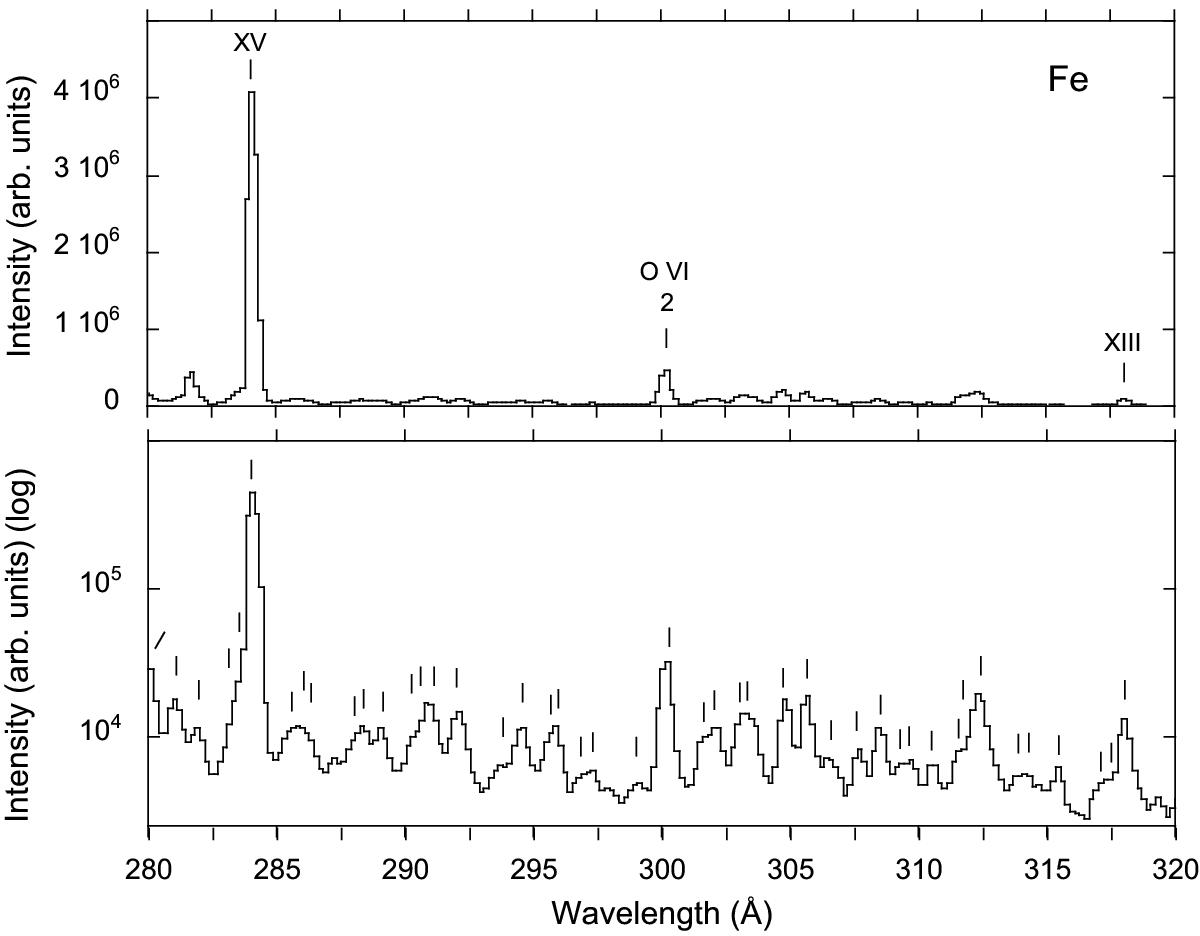
Spectrum of iron in the range λ280–λ320: the spectrum was recorded at the EBIT-I electron beam ion trap at an electron beam energy of 1000 eV. The lower part of the figure shows the spectrum in a logarithmic display. Fiducial markers indicate 45 line positions as judged visually at this spectral resolution. Only two of the many iron lines known in this wavelength range can be unambiguously assigned in this spectrum and are labeled by the spectrum number.
Current usage metrics show cumulative count of Article Views (full-text article views including HTML views, PDF and ePub downloads, according to the available data) and Abstracts Views on Vision4Press platform.
Data correspond to usage on the plateform after 2015. The current usage metrics is available 48-96 hours after online publication and is updated daily on week days.
Initial download of the metrics may take a while.