Fig. 6
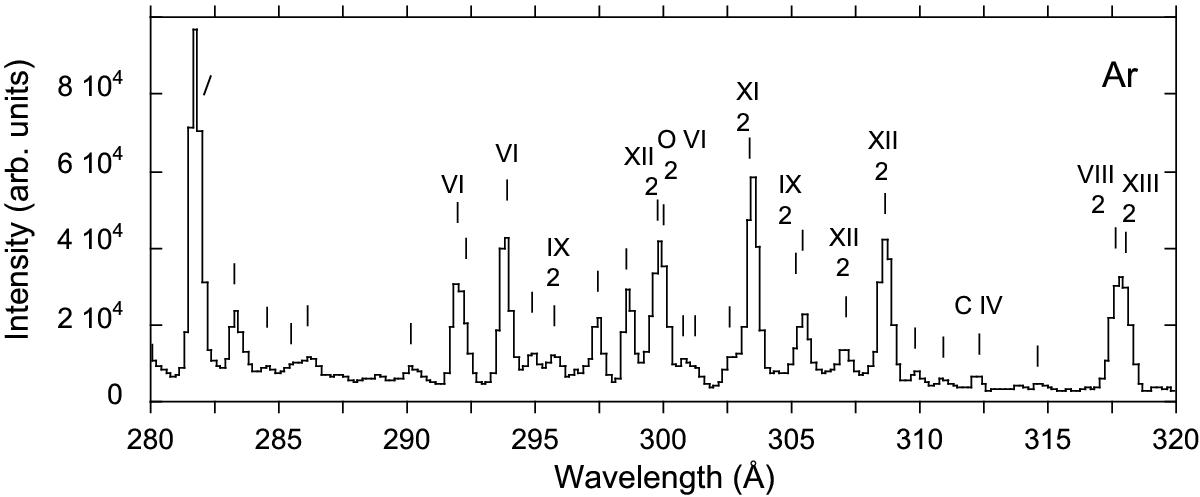
Spectrum of argon in the range λ280–λ320: the spectrum was recorded at the EBIT-I electron beam ion trap at an electron beam energy of 1000 eV. Eye-guiding markers indicate visual line positions. Known Ar lines are labeled by the spectrum number, while contamination lines from carbon and oxygen are labeled by the element. Lines that appear in second order of diffraction are marked by “2”.
Current usage metrics show cumulative count of Article Views (full-text article views including HTML views, PDF and ePub downloads, according to the available data) and Abstracts Views on Vision4Press platform.
Data correspond to usage on the plateform after 2015. The current usage metrics is available 48-96 hours after online publication and is updated daily on week days.
Initial download of the metrics may take a while.