Fig. 3
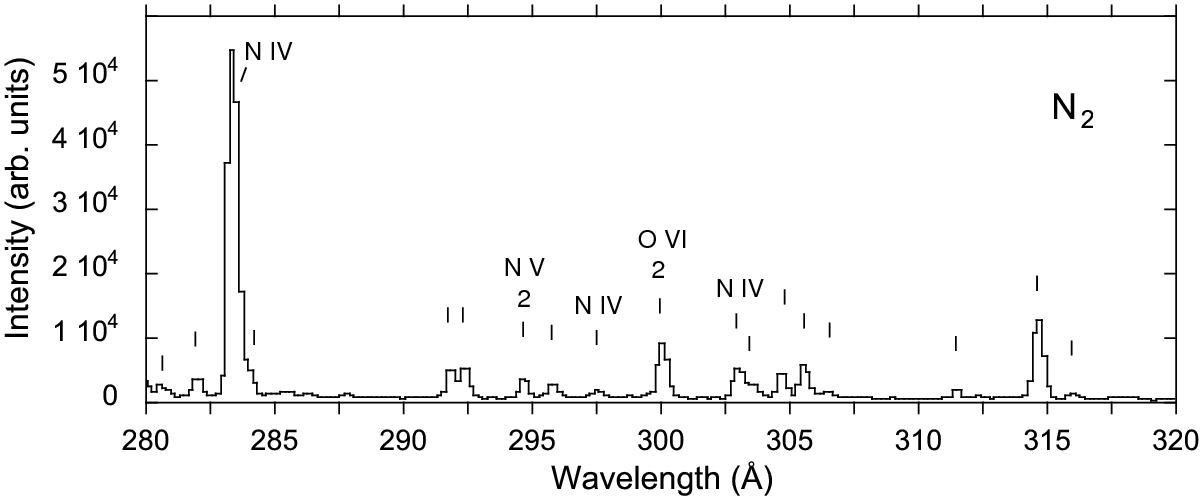
Spectrum of nitrogen in the range λ280–λ320: the spectrum was recorded at the EBIT-I electron beam ion trap at an electron beam energy of 1000 eV. The line markers are visual aids only, because the actual number of line components that can be discerned in spectral line fits of blends may depend on the available spectral resolution. Identified spectral features are labeled by the corresponding spectrum. Lines that are recognized as second diffraction order images are marked “2”.
Current usage metrics show cumulative count of Article Views (full-text article views including HTML views, PDF and ePub downloads, according to the available data) and Abstracts Views on Vision4Press platform.
Data correspond to usage on the plateform after 2015. The current usage metrics is available 48-96 hours after online publication and is updated daily on week days.
Initial download of the metrics may take a while.