Free Access
Fig. 2
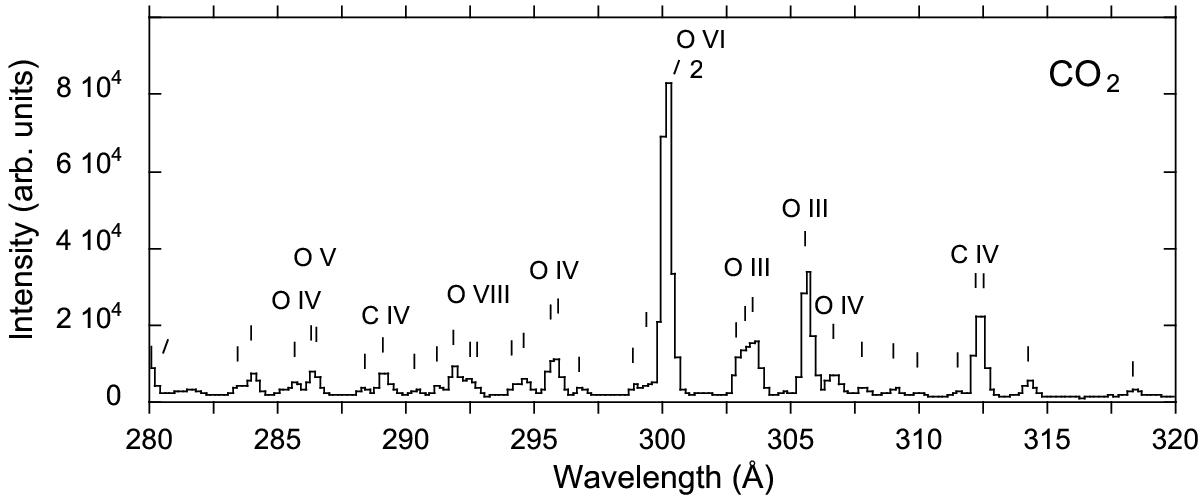
Spectrum of carbon and oxygen in the range λ280–λ320: the spectrum was recorded at the EBIT-I electron beam ion trap at an electron beam energy of 700 eV. Identified spectral features are labeled by the corresponding spectrum. The oxygen line near 300 Å appears in second diffraction order (marked “2”) .
Current usage metrics show cumulative count of Article Views (full-text article views including HTML views, PDF and ePub downloads, according to the available data) and Abstracts Views on Vision4Press platform.
Data correspond to usage on the plateform after 2015. The current usage metrics is available 48-96 hours after online publication and is updated daily on week days.
Initial download of the metrics may take a while.