Fig. 1
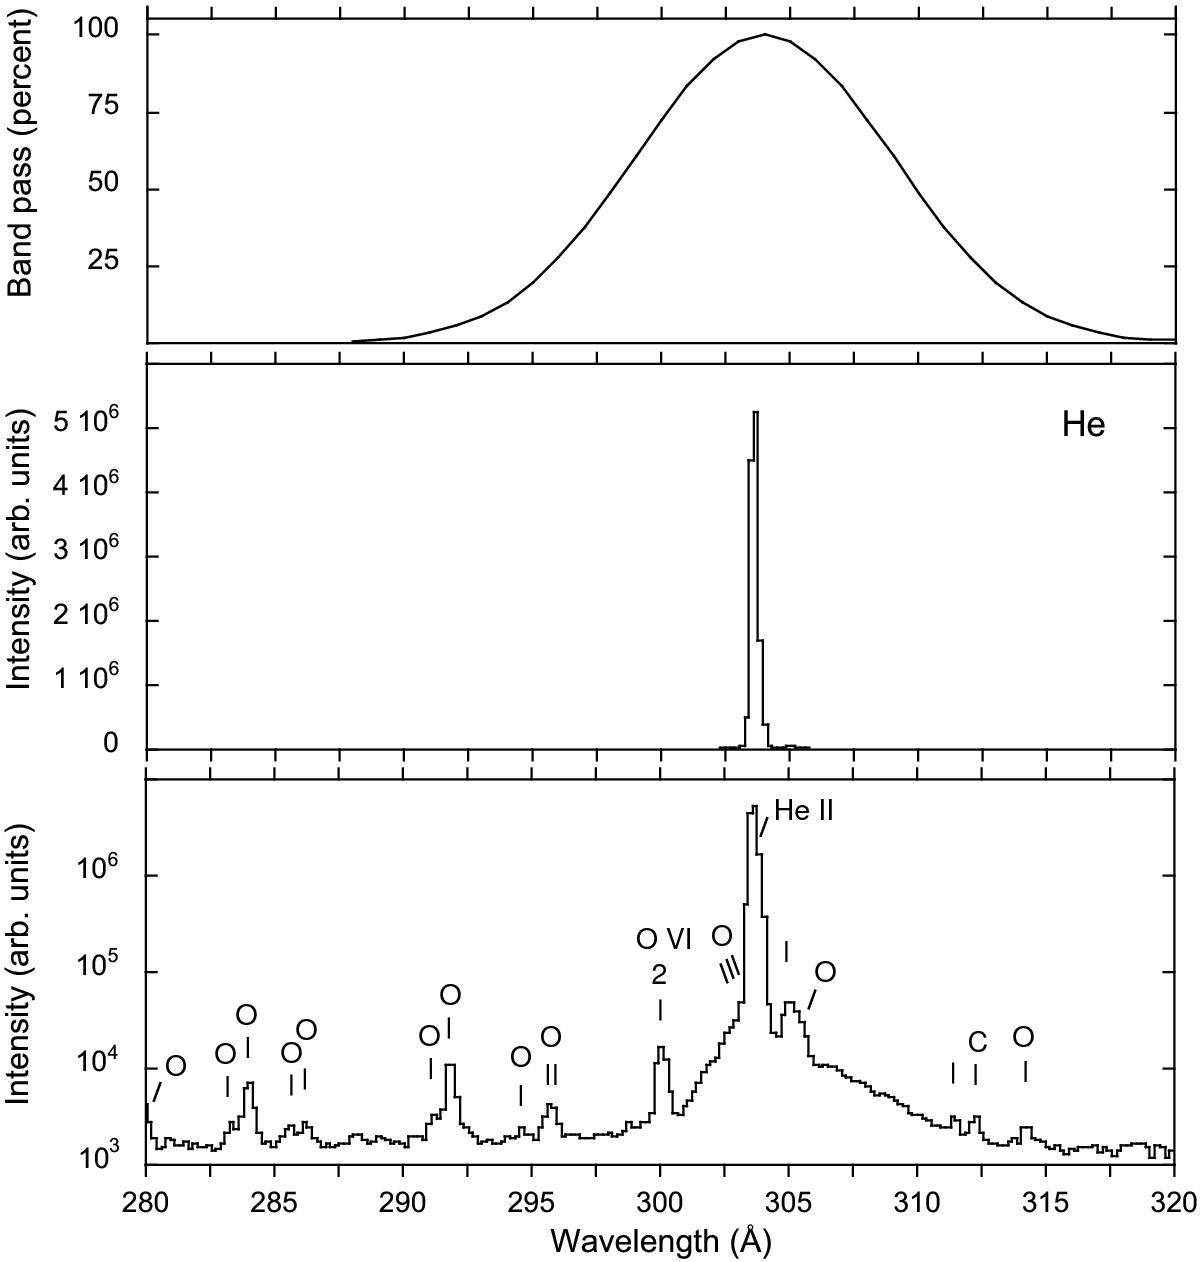
Spectrum of helium in the range λ280–λ320 recorded at the EBIT-I electron beam ion trap at an electron beam energy of 1000 eV. The only line that is recognizable at this scale is the He ii line at 303.78 Å. The band pass function of the SDO/AIA λ304 channel is indicated on top. The bottom of the figure shows the same spectrum on a logarithmic scale; at a level of more than three orders of magnitude weaker than the dominant helium line there are various oxygen lines in first and second diffraction order (marked by “2”).
Current usage metrics show cumulative count of Article Views (full-text article views including HTML views, PDF and ePub downloads, according to the available data) and Abstracts Views on Vision4Press platform.
Data correspond to usage on the plateform after 2015. The current usage metrics is available 48-96 hours after online publication and is updated daily on week days.
Initial download of the metrics may take a while.