Fig. 5
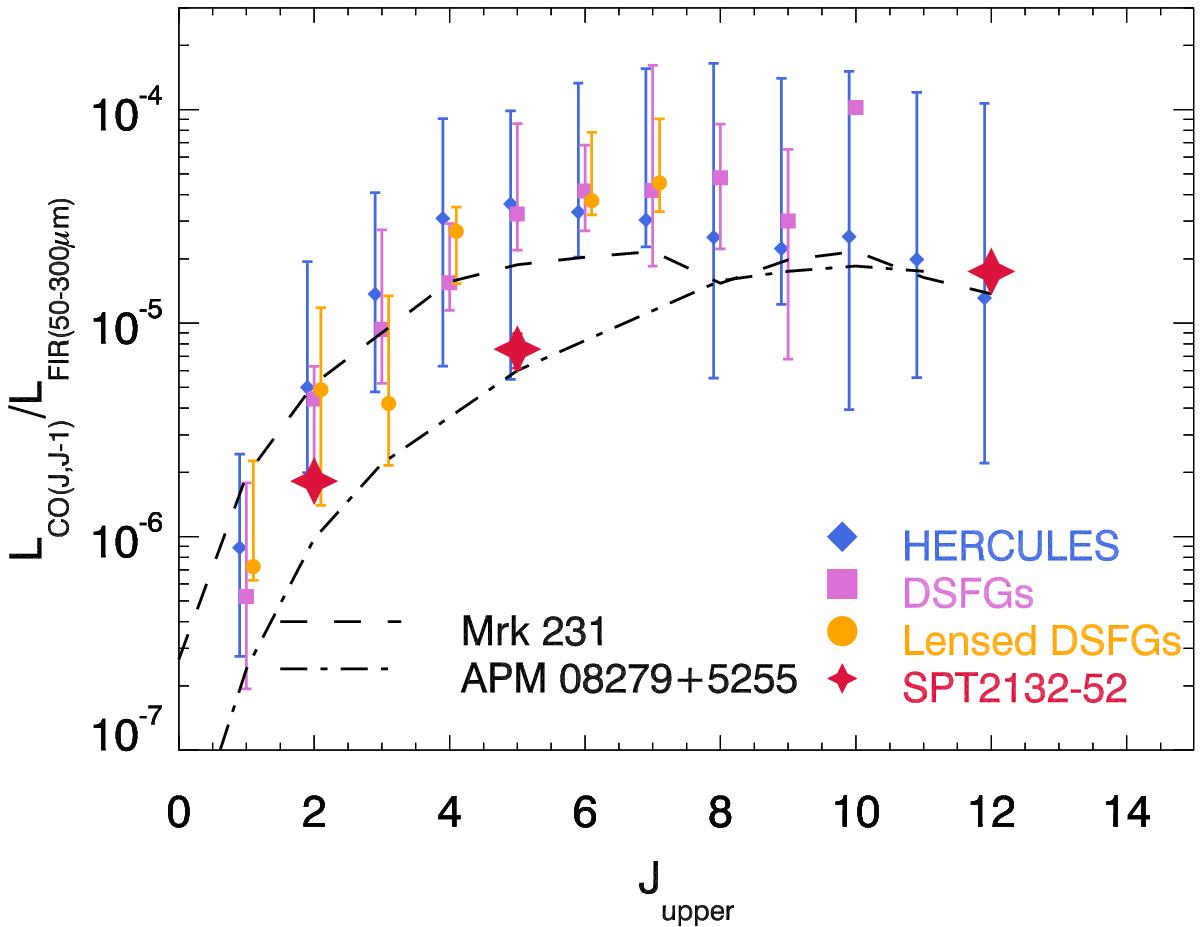
CO spectral line energy distribution (SLED) of SPT2132-58 normalized by LFIR. Our results are compared with three data compilations of Greve et al. (2014; the error bars indicate the lowest and highest value of their samples). The dashed line is the SLED of Mrk231 (Rosenberg et al. 2015) and the dash-dotted line is the SLED of APM 08279 +5255 (Downes et al. 1999; Weiß et al. 2007; Riechers et al. 2009; Bradford et al. 2011).
Current usage metrics show cumulative count of Article Views (full-text article views including HTML views, PDF and ePub downloads, according to the available data) and Abstracts Views on Vision4Press platform.
Data correspond to usage on the plateform after 2015. The current usage metrics is available 48-96 hours after online publication and is updated daily on week days.
Initial download of the metrics may take a while.