Fig. 1
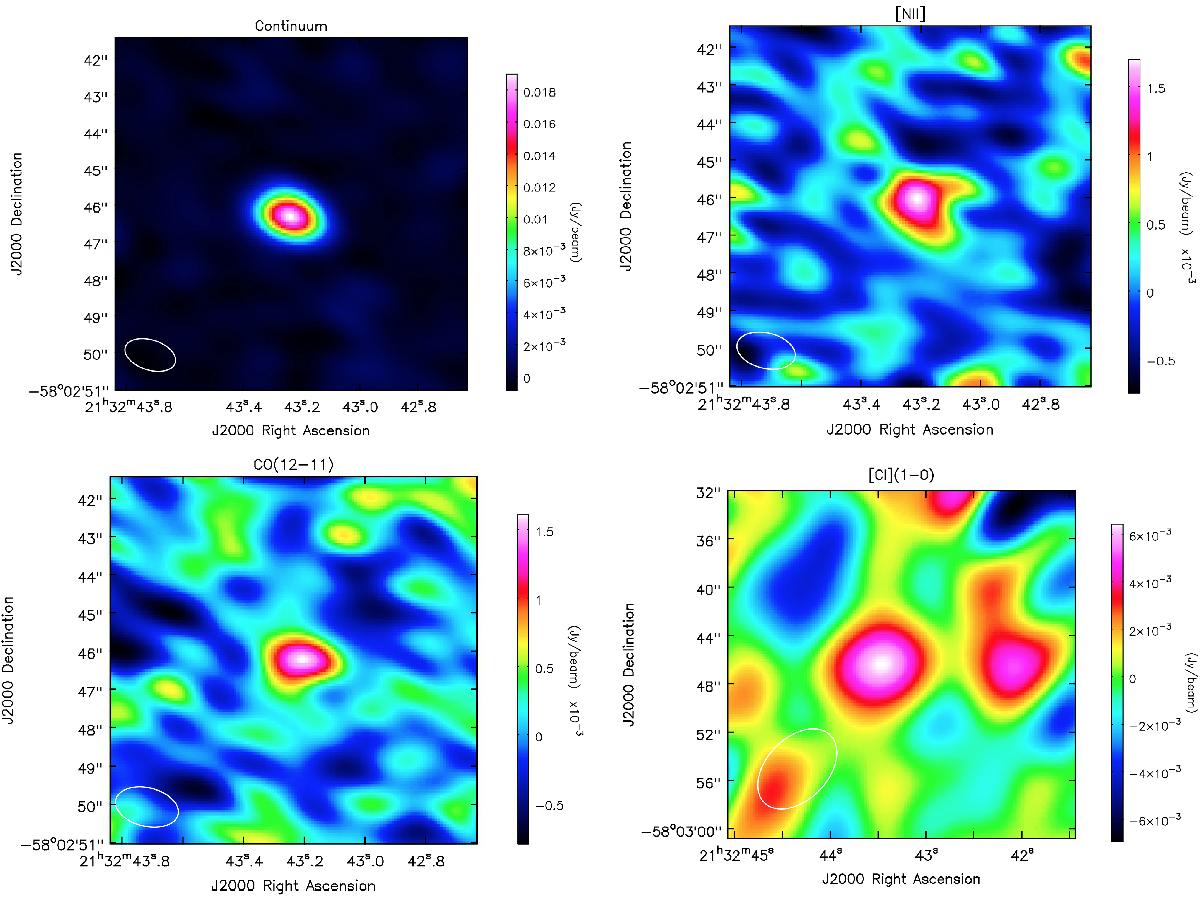
Maps of the continuum (top left), the [NII] line (top right), the CO(12−11) line (bottom left), and the [CI](1−0) line (bottom right). The size of the beam is indicated in the lower left corner. [NII] and CO(12−11) were integrated between −300 and +300 km s-1. Since the [CI](1−0) line is narrower and fainter, it was integrated between −100 and +100 km s-1 to maximize the signal-to-noise ratio. The beam in band 3 ([CI](1−0)) is much larger than in band 6. We thus stretch the x- and y-axis by a factor 3.
Current usage metrics show cumulative count of Article Views (full-text article views including HTML views, PDF and ePub downloads, according to the available data) and Abstracts Views on Vision4Press platform.
Data correspond to usage on the plateform after 2015. The current usage metrics is available 48-96 hours after online publication and is updated daily on week days.
Initial download of the metrics may take a while.