Fig. 5
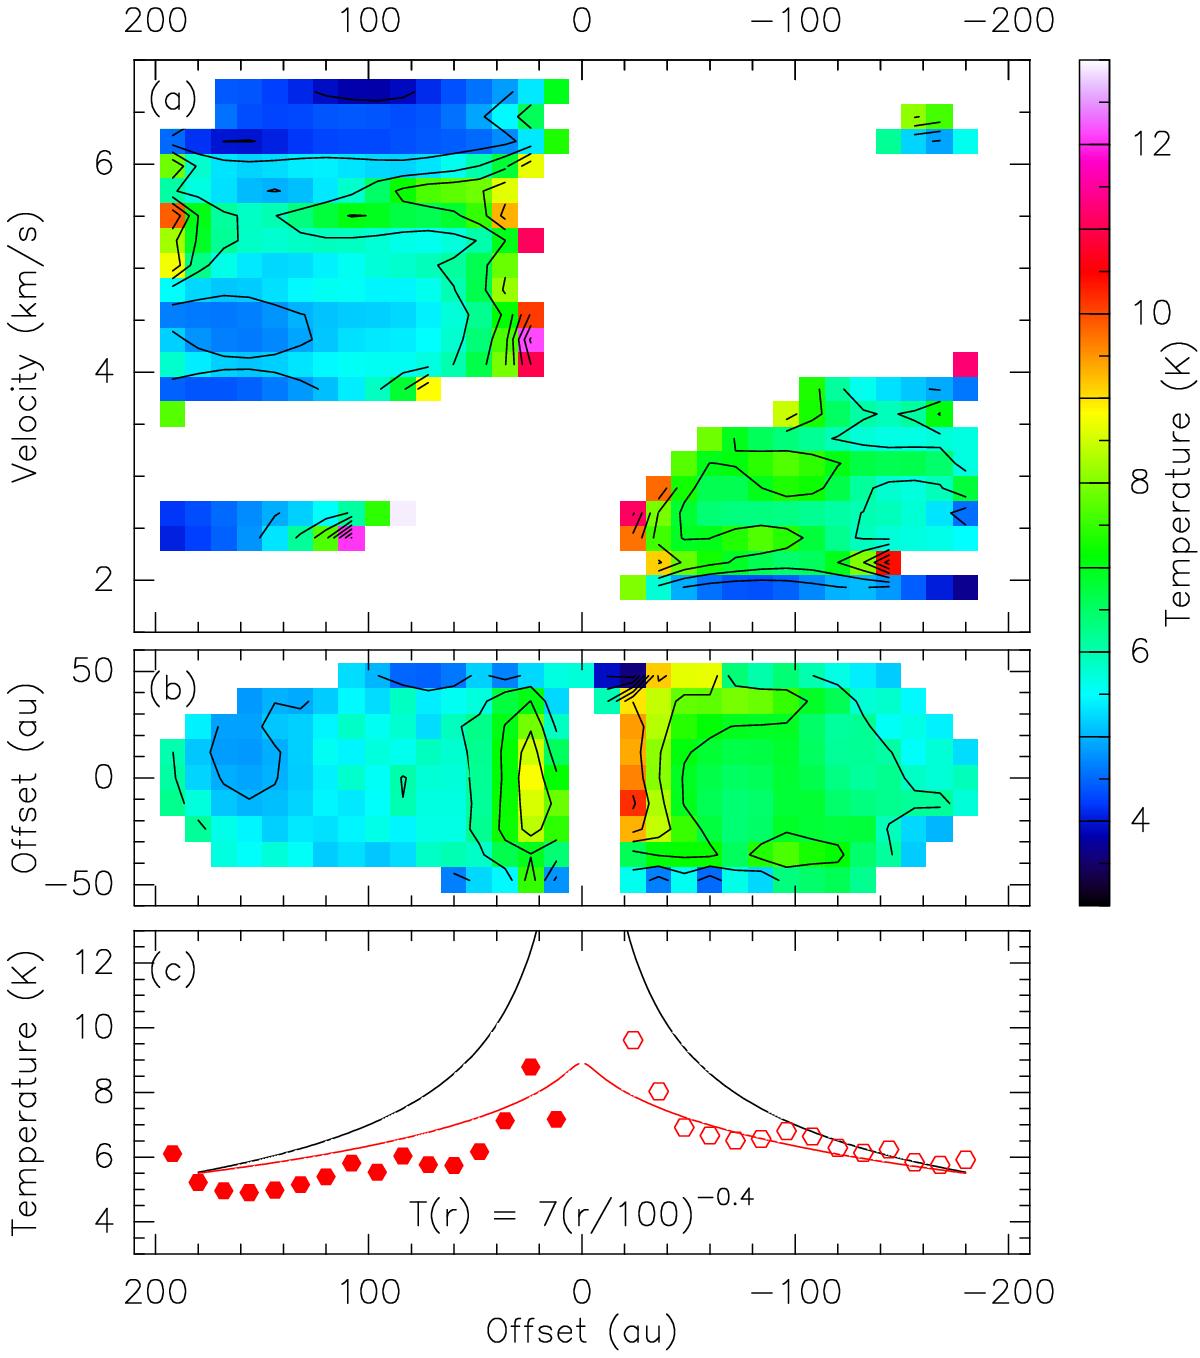
a) Dust temperatures derived as a function of position (impact parameter in au) and velocity. b) Map of the dust temperature, taken as the mean of all valid values derived for different velocities. The typical error on the mean is ≤1 K. c) Cut along the disk plane and comparison between the local temperature and the line-of-sight average (in red).
Current usage metrics show cumulative count of Article Views (full-text article views including HTML views, PDF and ePub downloads, according to the available data) and Abstracts Views on Vision4Press platform.
Data correspond to usage on the plateform after 2015. The current usage metrics is available 48-96 hours after online publication and is updated daily on week days.
Initial download of the metrics may take a while.