Fig. 4
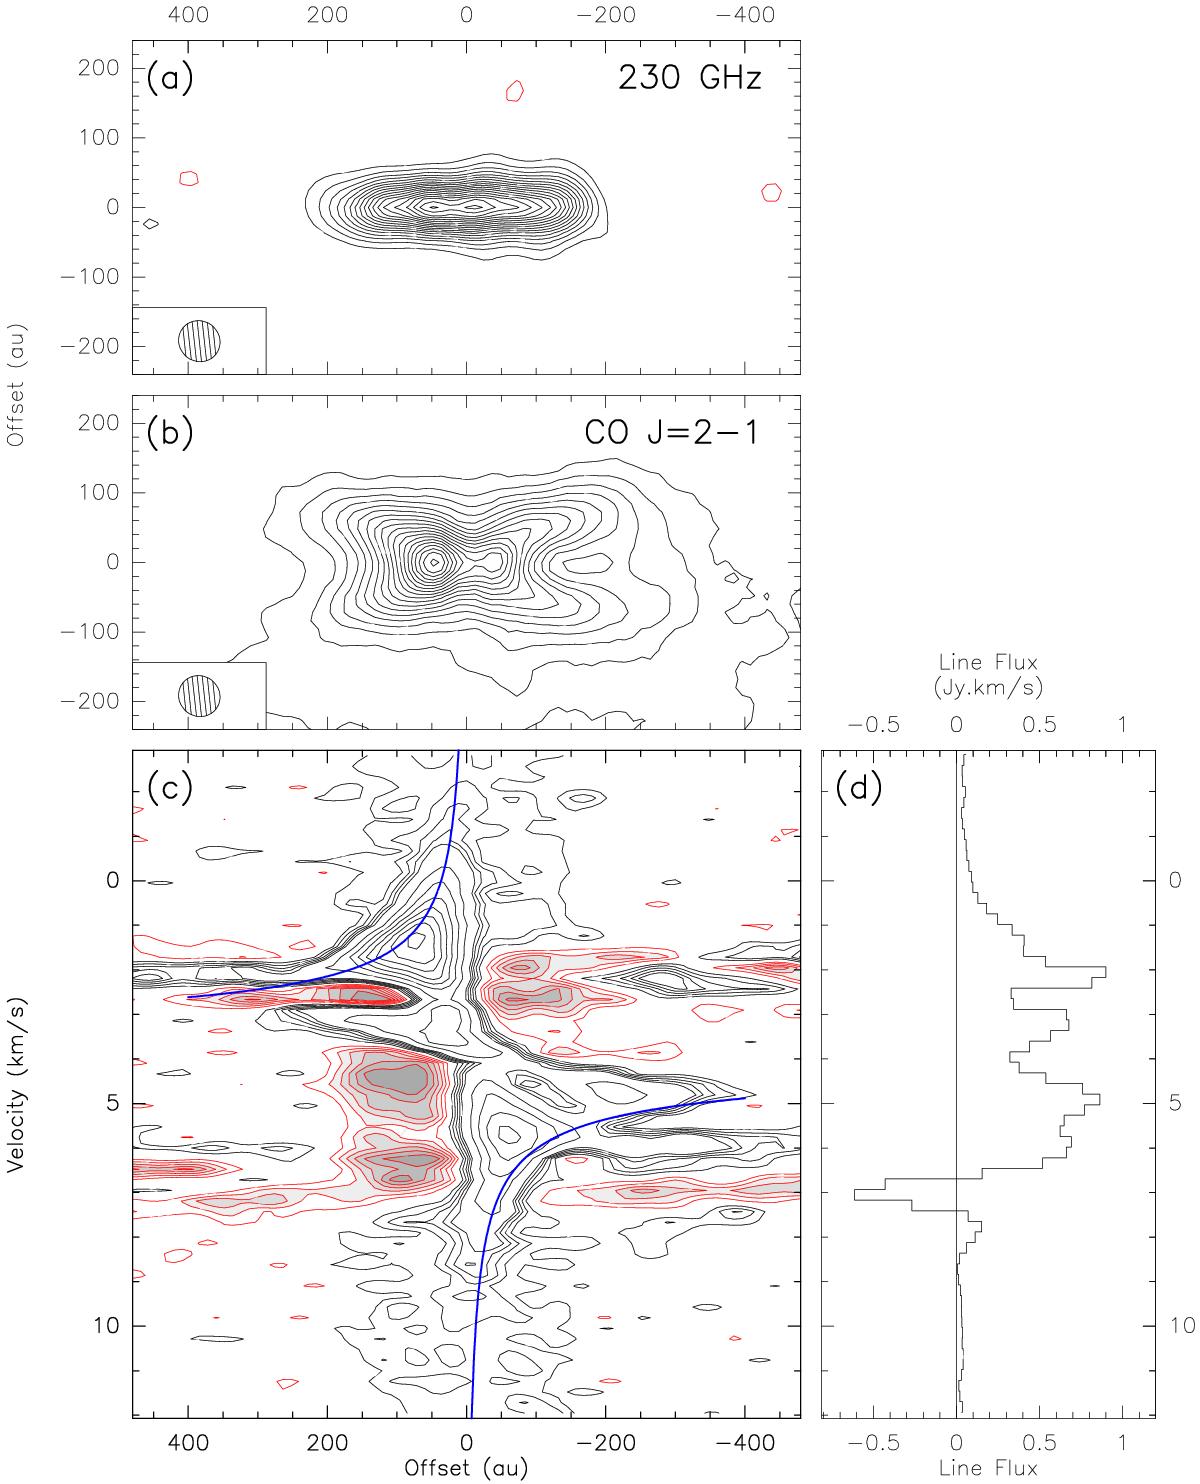
a) Continuum emission at 230 GHz; contour spacing is 0.4 mJy/beam. b) Integrated CO line flux; contour spacing is 20 mJy/beam km s-1. c) Position-velocity diagram across the disk plane; contour spacing as in Fig. 3. The blue curve is the Keplerian velocity for a 0.57 M⊙ star. d) Integrated CO spectrum over the disk. Images have been rotated by 3° clockwise to align the disk along the x-axis.
Current usage metrics show cumulative count of Article Views (full-text article views including HTML views, PDF and ePub downloads, according to the available data) and Abstracts Views on Vision4Press platform.
Data correspond to usage on the plateform after 2015. The current usage metrics is available 48-96 hours after online publication and is updated daily on week days.
Initial download of the metrics may take a while.