Fig. 3
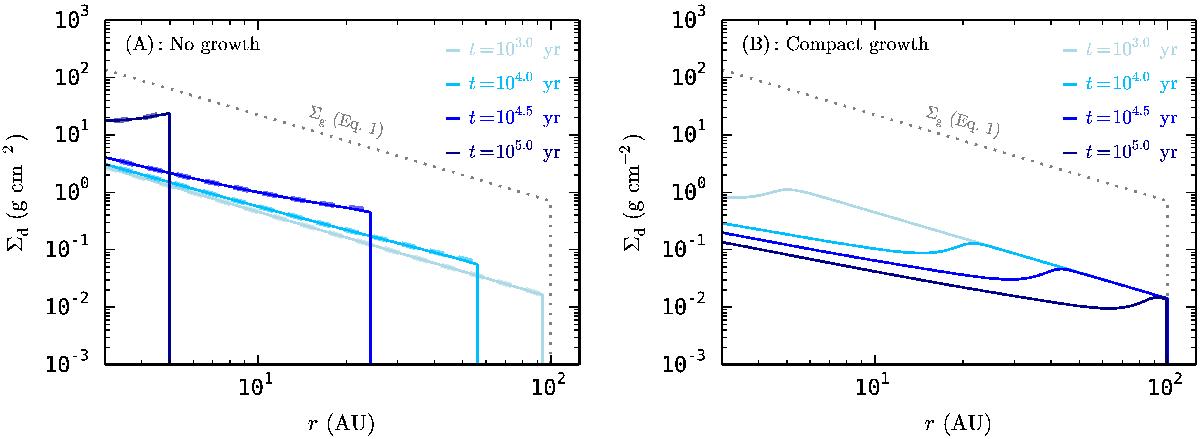
Evolution of the dust surface density in time. A) No growth case. Particles always have a = 1 mm. The dashed lines show analytical results of Youdin & Shu (2002). B) Compact growth with perfect sticking. Dust particles start out as 0.1 μm monomers and grow on timescales given by Eq. (11), while staying compact at all times (φ = 1). The gas surface density is shown by the dotted line. The results are qualitatively different, with the no-growth case resulting in pile-ups (locally increasing Σd/ Σg) and the compact coagulation model showing an inside-out removal of dust (decreasing Σd/ Σg everywhere).
Current usage metrics show cumulative count of Article Views (full-text article views including HTML views, PDF and ePub downloads, according to the available data) and Abstracts Views on Vision4Press platform.
Data correspond to usage on the plateform after 2015. The current usage metrics is available 48-96 hours after online publication and is updated daily on week days.
Initial download of the metrics may take a while.